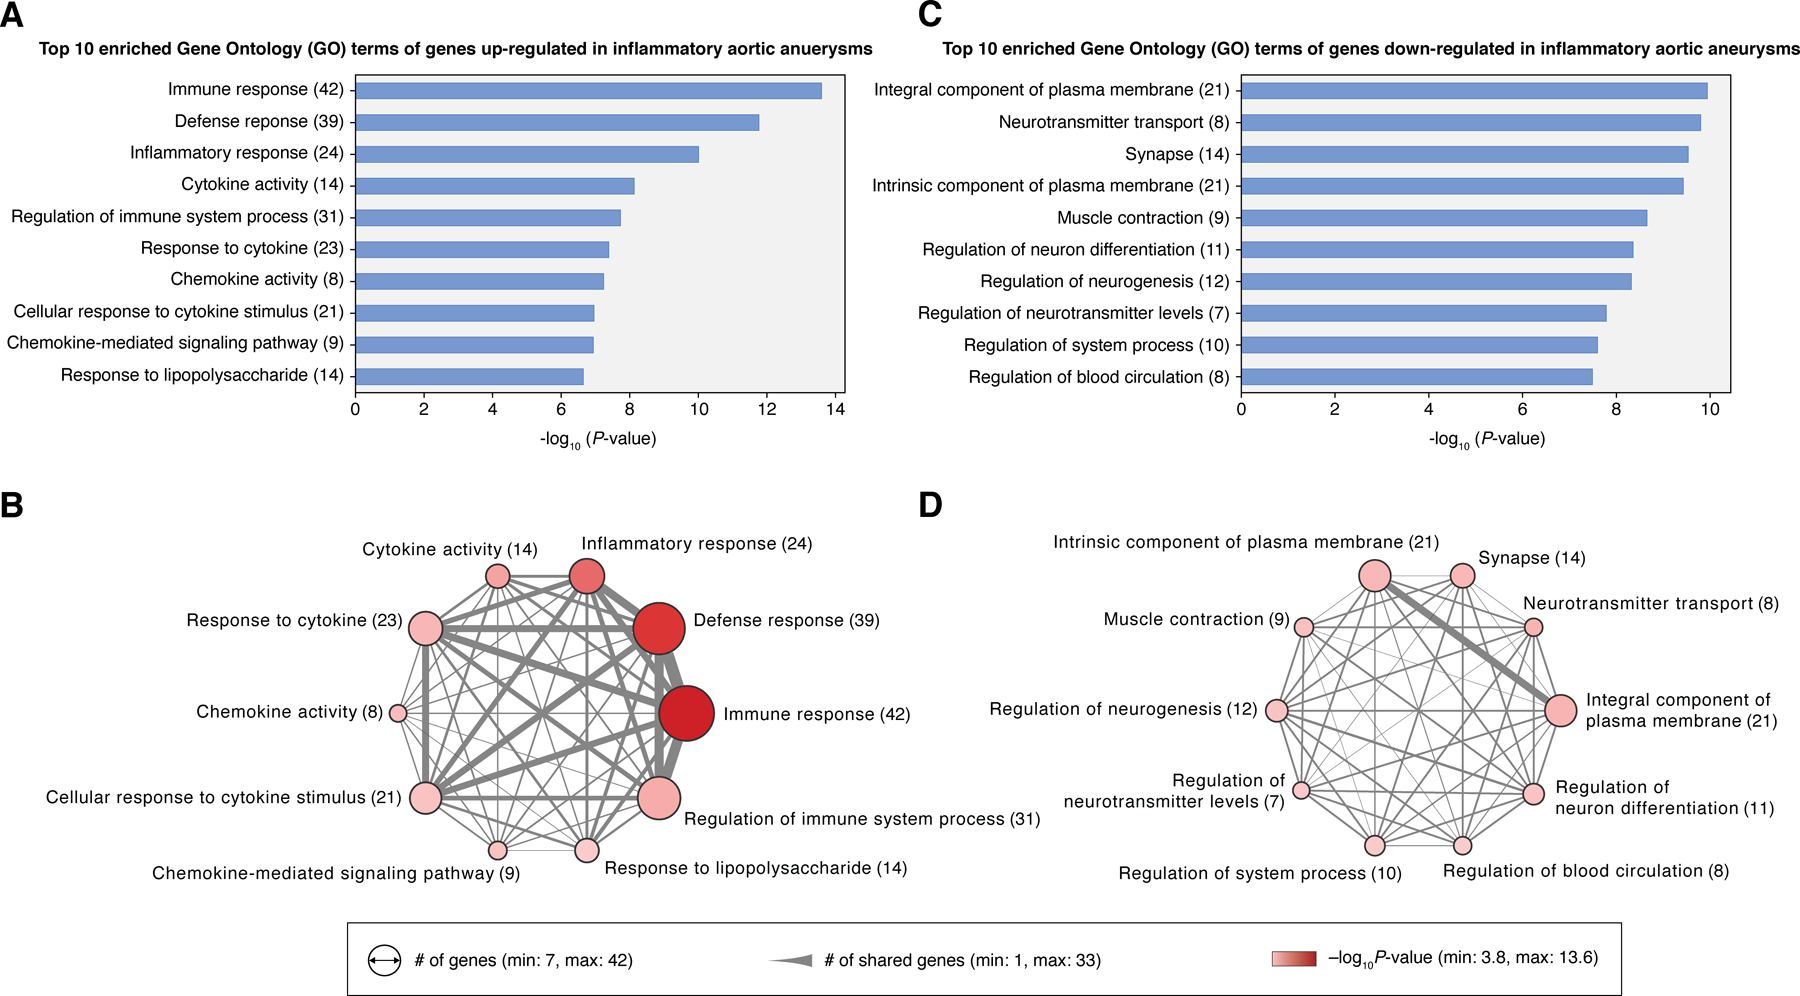
Figure 3. Gene Ontology (GO) enrichment analysis reveals strong upregulation of immune response and downregulation of neuronal activity in inflammatory aortic aneurysms.

(A) Top 10 enriched GO terms of the upregulated DEGs (n = 159) and (B) their gene set similarities illustrated in a network diagram. (C) Top 10 enriched GO terms of the downregulated DEGs (n = 93) and (D) a network of their gene set similarities. Size of nodes in the network corresponds to the number of genes of each GO term. The width of the edge represents the number of genes common to both GO terms. Colors of nodes (pink to red) signify the statistical significance of GO enrichment. Gene set enrichment analysis on GO terms was performed in DAVID (v6.8).
