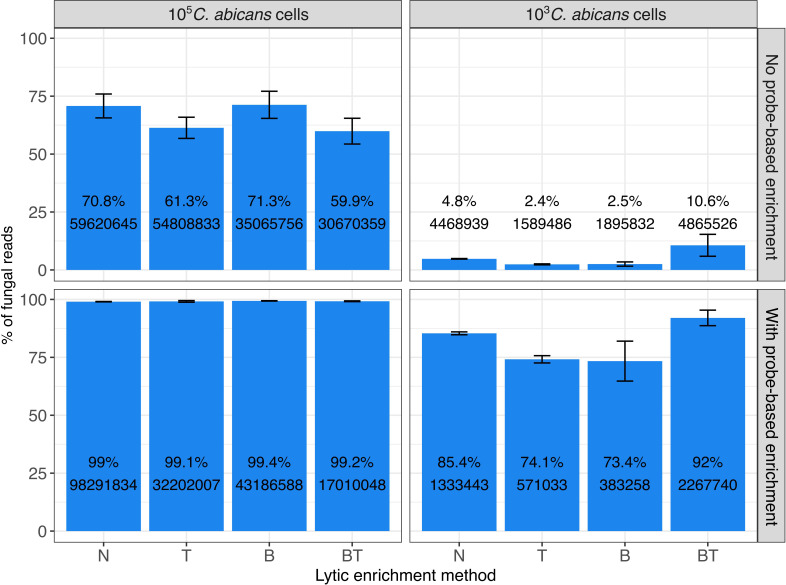
Figure 2.
Proportions of fungal RNA reads obtained after different treatment/enrichment approaches (N, T, B, BT), and with or without probe-based enrichment, as determined by RNA-Seq. Left panel shows data of experiments with 105 C. albicans cells (“High fungal load”), right panel - with 103 fungal cells (“Low fungal load”). Upper panel shows data on experiments with no probe-based enrichment, and the bottom panel - with probe-based enrichment. N: No thiolutin and no lytic enrichment; T: Thiolutin and no lytic enrichment; B: No thiolutin and buffer RLT + β-mercaptoethanol lytic enrichment; BT: Thiolutin and Buffer RLT + β-mercaptoethanol lytic enrichment. Bars represent the proportion (in %, y axis) of mapped fungal reads over the total number of mapped reads to C. albicans and the human genomes, calculated as mean and standard deviation across three replicates. Labels on the bars represent the mean percentage (at the top) and mean raw read counts (at the bottom) across replicates.

