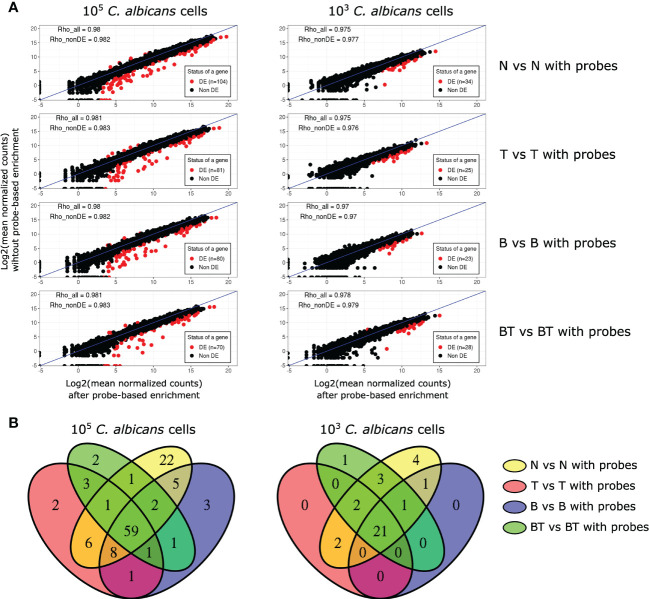
Figure 3.
Analysis of the effect of probe-based enrichment on the expression levels of C. albicans genes across all experimental conditions. (A) Correlation plots of average normalized fungal read counts between original (y-axis) and probe-enriched (x-axis) samples. DE - Differentially Expressed; Rho_all - Spearman’s correlation coefficients calculated with all genes; Rho_nonDE: Spearman’s correlation coefficients calculated with all genes, excluding differentially expressed ones; (B) Venn diagrams of DE genes between non-probe-enriched and probe-enriched samples.

