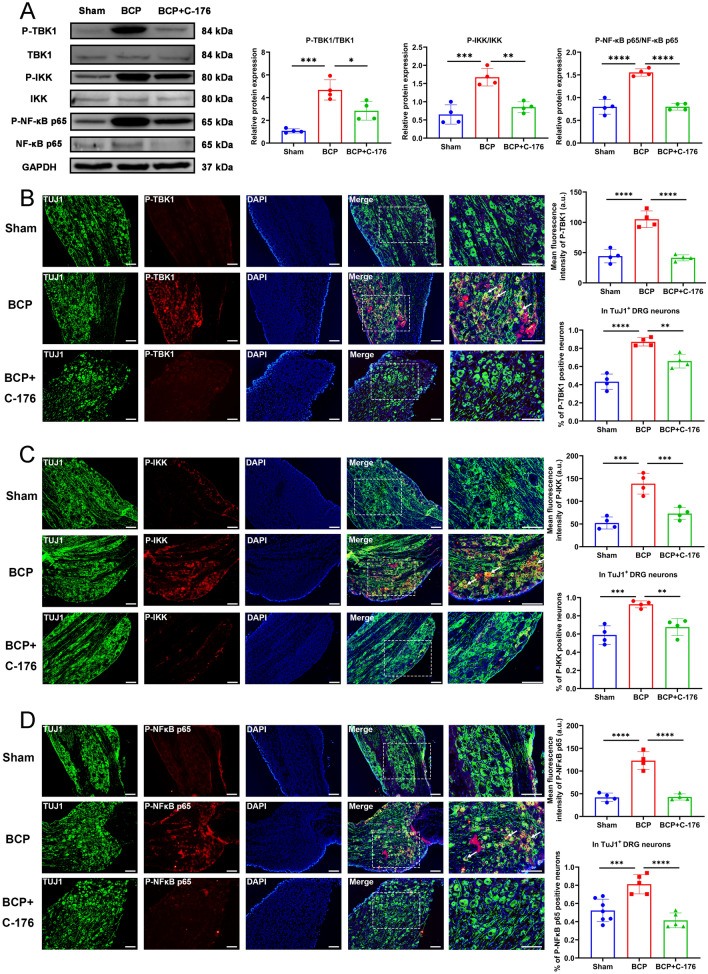
Fig. 7.
Expression of downstream signaling pathway of STING after the intraperitoneal injection of C-176. A The expression of P-TBK1/TBK1, P-IKK/ IKK and P-NF-κB p65/NF-κB p65 in the L3–L5 DRGs of rats after the injection of C-176 were determined by western blotting. Representative protein bands were on the right. GAPDH was detected as an internal control. The expression and cellular localization of P-TBK1 (B), P-IKK (C) and P-NF-κB p65 (D) in the L3-L5 DRGs of rats in the DRGs were determined by immunofluorescence. Representative IF images of P-TBK1 (red), P-IKK (red), P-NF-κB p65 (red), TuJ1 (green) and DAPI (blue) are shown on the right. The white arrows indicate typical co-stained cells. Scale bar = 50 μm. Mean fluorescence intensity (upper) and percentage of positive neurons in TuJ1 + DRG neurons (down) are shown on the left. Data are expressed as mean ± SEM. *p < 0.05, **p < 0.01, ***p < 0.001, ****p < 0.0001. n = 4 per group (color figure online)

