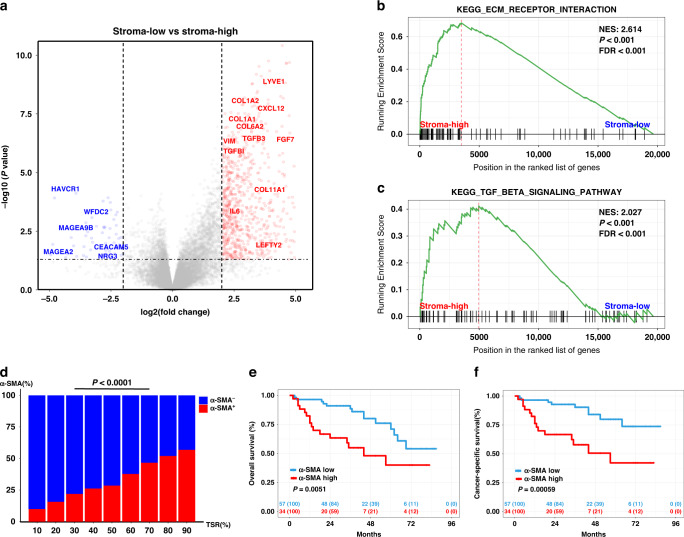
Fig. 4. Stroma-high tumours were characterised by abundant cancer-associated fibroblasts (CAFs).
a Volcano plot showing the difference in RNA expression between stroma-high and stroma-low tumours. (Genes with fold change ≥2 and statistical significance are marked with red dots). b, c Gene Set Enrichment Analysis (GSEA) enrichment score curves of stroma-low vs. stroma-high tumours. d The distribution of low and high α-SMA expression in different tumour–stroma ratio (TSR) of patients with UTUC. Chi-square test was applied. e, f Overall survival (OS) and cancer-specific survival (CSS) of patients with low and high α-SMA expression in patients with UTUC.

