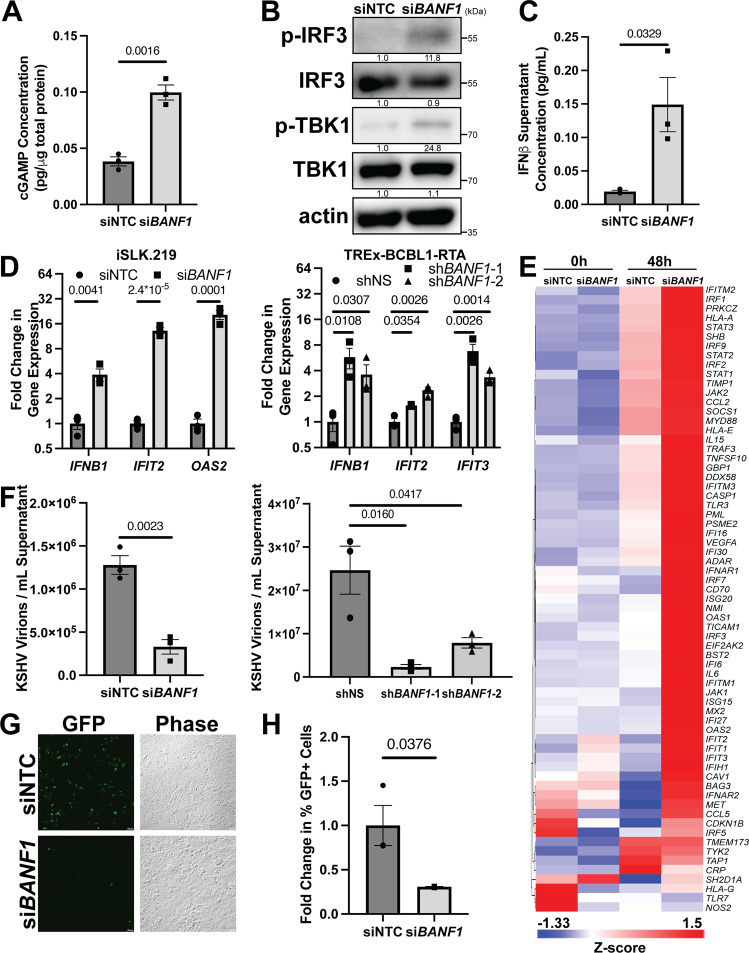
Fig. 2. BAF antagonizes the cGAS-STING response to KSHV reactivation.
iSLK.219 cells were transfected with NTC siRNA or BANF1 targeting siRNA for 48 h prior to the addition of 25 ng/mL doxycycline. TREx-BCBL1-RTA cells were transduced with lentiviral shRNA for 72 h prior to the addition of 1000 ng/mL doxycycline. A iSLK.219 cell lysates were collected at 72 h post-doxycycline treatment and analyzed by 2’3’-cGAMP ELISA. B iSLK.219 cell lysates were collected at 48 h post-doxycycline treatment and analyzed by western blotting with the indicated antibodies. C iSLK.219 culture supernatant was harvested at 72 h post-doxycycline treatment and analyzed by IFNβ ELISA. D Cells were harvested for RNA at 48 h (iSLK.219) or 96 h (TREx-BCBL1-RTA) post-doxycycline treatment and RT-qPCR was subsequently performed to determine ISG mRNA expression levels. E iSLK.219 cDNA as prepared in (D) was analyzed by Human Type I Interferon Response RT2 Profiler PCR Array (Qiagen, GeneGlobe ID: PAHS-016Z). Data shown are the Z-score of the fold change (2-ΔΔCt) over the geometric mean expression of four housekeeping genes averaged over two independent biological replicates. The heatmap was prepared using Partek Flow. F Culture supernatants were harvested at either 72 h (iSLK.219) or 96 h (TREx-BCBL1-RTA) post-doxycycline treatment and DNase treated prior to DNA extraction. DNase-resistant KSHV genomes were quantified by real-time qPCR. G iSLK.219 culture supernatants were transferred to naive HEK293 cells at 72 h post-doxycycline treatment. GFP + infected cells were measured at 48 h post-infection by fluorescent microscopy and (H) quantified by flow cytometry. P values are the result of two-tailed Student’s T tests unless otherwise specified. Error bars indicate the standard error of the mean of three independent biological replicates. Source data are provided as a source data file.

