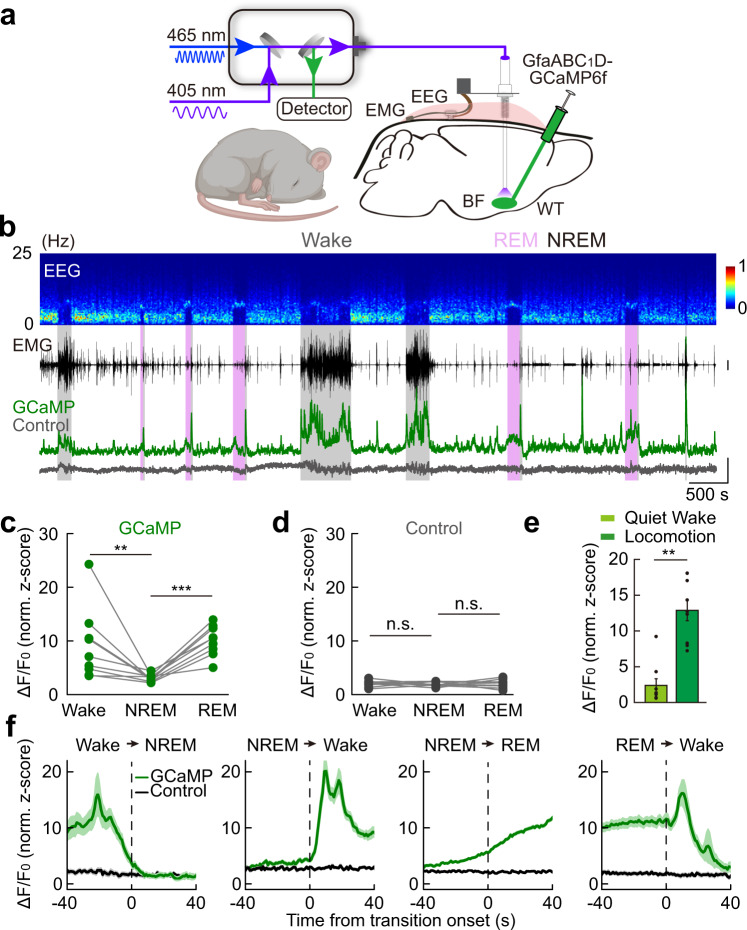
Fig. 2. Brain state-dependent astrocyte Ca2+ activity in the BF during the sleep–wake cycle.
a Schematic diagram depicting fiber photometry recording of astrocyte Ca2+ transients in the BF during the sleep–wake cycle. b Top to bottom: EEG power spectrogram; EMG (scale, 1 mV); photometry signals of GCaMP (green) and isosbestic excitation (gray) (scale, 1 z-score). The brain states are color-coded; the same color coding is used in all the following figures. c GCaMP fluorescence in different brain states. Each line represents data from one recording. n = 9 sessions from 4 mice; Wake vs NREM: **P = 0.0039 (Wilcoxon signed-rank test); REM vs NREM: ***P < 0.001 (Paired t-test). In this and all subsequent figures, summary data are expressed as the means ± SEM. d Fluorescence of the isosbestic excitation of GCaMP in different brain states. n = 9 sessions from 4 mice. n.s., not significant; Wake vs NREM: P = 0.74; REM vs NREM: P = 0.85; Paired t-test. e Astrocyte Ca2+ signal during quiet wakefulness and locomotion. n = 9 recording sections from 3 mice for both groups. **P = 0.0039 (Wilcoxon signed-rank test). f GCaMP and control signal during brain state transitions. The vertical dashed lines represent the transition time. n = 39, 134, 262, and 43 events from 4 mice for each panel, respectively.

