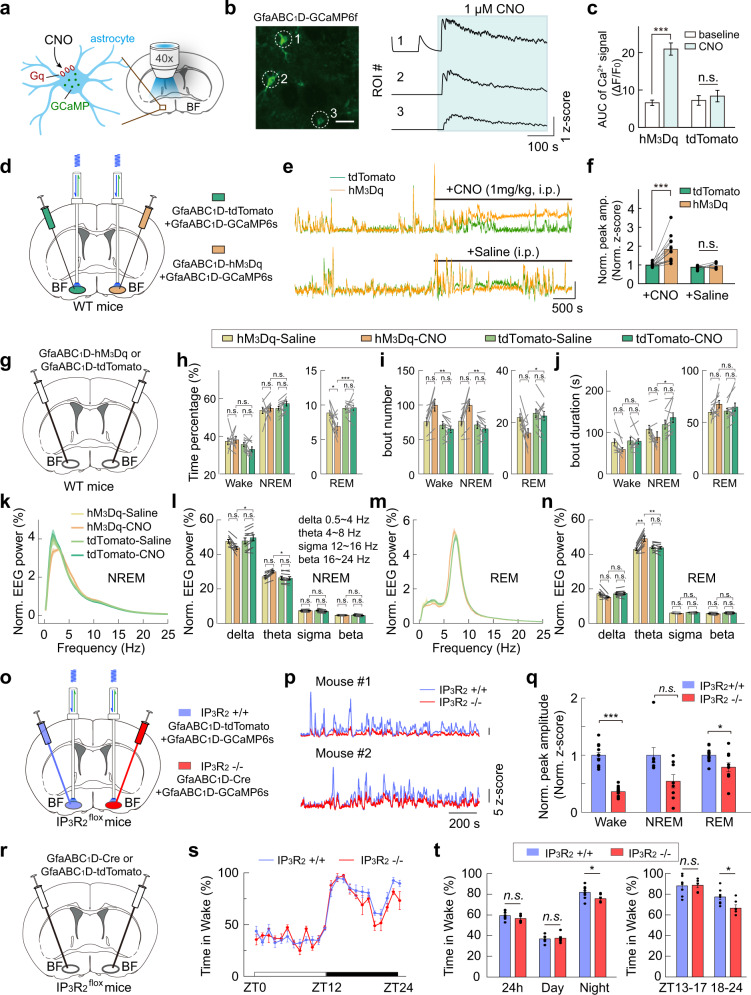
Fig. 3. Sleep–wake modulation by astrocyte Ca2+ activity in the BF.
a Schematic diagram depicting Ca2+ imaging from hM3Dq-expressing astrocytes in brain slices. b Left, confocal image showing GCaMP-expressing astrocyte in a brain slice (scale, 50 µm); right, Ca2+ signals of the individual region of interest (ROI). c Quantification of CNO-evoked Ca2+ signals. AUC, area under the curve. AUC measures the area of Ca2+ signals during baseline (the 2-min period prior to CNO infusion) and after bath application of CNO (2 min). hM3Dq group: n = 99 ROIs; ***P < 0.001. tdTomato group: n = 51 ROIs; P = 0.093. (Paired t-test). d–f Chemogenetic activation of BF astrocytes in live mice. d Schematic diagram depicting fiber photometry recording of chemogenetic activation-induced astrocyte Ca2+ signal. AAVs expressing GfaABC1D-tdTomato and GfaABC1D-GCaMP6s were injected into the BF of one hemisphere, and AAVs expressing GfaABC1D-hM3Dq and GfaABC1D-GCaMP6s were injected into the contralateral BF. e Example traces showing astrocyte Ca2+ signal from the BF expressing tdTomato (green) or hM3Dq (yellow), respectively. Free-behaving mice were injected with CNO (1 mg/kg, i.p.) or saline (i.p.). Scale, 2 normalized z-score. f Quantitative comparison of astrocyte Ca2+ signal from the BF expressing tdTomato (green) or hM3Dq (yellow) in response to CNO or saline injections. The mean ratio between the size of astrocyte Ca2+ events from the hM3Dq- and tdTomato-expressing BF was calculated before and after CNO or saline injections. CNO injection significantly increased the size of GCaMP events in hM3Dq-expressing BF (186% increase, ***P < 0.001, Paired t-test), whereas saline injection had no detectable effect (P = 0.43, Paired t-test). CNO injections, n = 13 sessions from 4 mice; Saline injections, n = 7 sessions from 4 mice. g Schematic diagram depicting chemogenetic activation of astrocytes in the BF in wide-type (WT) mice. h–n Chemogenetic activation of BF astrocytes in WT mice significantly changed sleep–wake behavior (within the 4 h after CNO injection). hM3Dq group, n = 9 mice; tdTomato group, n = 10 mice. The statistical method was two-way repeated measures ANOVA, followed by Tukey’s post hoc multiple comparison test. Time percentage (h), bout number (i), and bout duration (j) of the three brain states after CNO or saline injections. In h, hM3Dq-CNO vs tdTomato-CNO: Wake, P = 0.084; NREM, P = 0.57; REM, ***P < 0.001. hM3Dq-Saline vs hM3Dq-CNO: Wake, P = 0.98; NREM, P = 0.92; REM, *P = 0.012. tdTomato-Saline vs tdTomato-CNO: Wake, P = 0.54; NREM, P = 0.49; REM, P = 1.0. In i, hM3Dq-CNO vs tdTomato-CNO: Wake, **P = 0.0026; NREM, **P = 0.0028; REM, *P = 0.033. hM3Dq-Saline vs hM3Dq-CNO: Wake, P = 0.051; NREM, P = 0.054; REM, P = 0.065. tdTomato-Saline vs tdTomato-CNO: Wake, P = 0.87; NREM, P = 0.88; REM, P = 0.96. In j, hM3Dq-CNO vs tdTomato-CNO: Wake, P = 0.22; NREM, *P = 0.029; REM, P = 0.91. hM3Dq-Saline vs hM3Dq-CNO: Wake, P = 0.34; NREM, P = 0.62; REM, P = 0.31. tdTomato-Saline vs tdTomato-CNO: Wake, P = 1.0; NREM, P = 0.67; REM, P = 0.79. k Normalized NREM EEG power after the injection of CNO or saline in hM3Dq- or tdTomato-expressing mice. l Quantification of NREM EEG power in delta, theta, sigma, and beta bands. hM3Dq-CNO vs tdTomato-CNO: delta, *P = 0.039; theta, *P = 0.014; sigma, P = 0.54; beta, P = 0.60. hM3Dq-Saline vs hM3Dq-CNO: delta, P = 0.27; theta, P = 0.083; sigma, P = 1.0; beta, P = 1.0. tdTomato-Saline vs tdTomato-CNO: delta, P = 0.79; theta, P = 0.99; sigma, P = 0.46; beta, P = 0.42. m, n Same as k, l, except that REM EEG was analyzed. In n, hM3Dq-CNO vs tdTomato-CNO: delta, P = 0.065; theta, **P = 0.0041; sigma, P = 0.16; beta, P = 0.17. hM3Dq-Saline vs hM3Dq-CNO: delta, P = 0.091; theta, **P = 0.0012; sigma, P = 0.71; beta, P = 0.86. tdTomato-Saline vs tdTomato-CNO: delta, P = 0.99; theta, P = 1.0; sigma, P = 1.0; beta, P = 1.0. o–q IP3R2 knockout (KO) reduced astrocyte Ca2+ activity during both wakefulness and REM sleep. o Schematic diagram depicting fiber photometry recording of astrocyte Ca2+ signal in the BF to examine the effect of IP3R2-KO. p Example astrocyte Ca2+ signal from the BF expressing Cre (red, IP3R2−/−) or control virus (light blue, IP3R2+/+), respectively. Scale bar = 200 s and 5 z-score. q Quantitative comparison of astrocyte Ca2+ signal from the BF expressing Cre (red, IP3R2−/−) or control virus (light blue, IP3R2+/+) during different brain states. Wake, reduced by 64%, ***P < 0.001, Paired t-test; NREM, P = 0.078, Wilcoxon signed-rank test; REM, reduced by 21%, *P = 0.021, Paired t-test; n = 12 recordings from 4 mice (3 recordings per mouse). r–t IP3R2-KO in BF astrocytes reduced wakefulness in the late phase of the night. r Schematic diagram of suppressing astrocyte Ca2+ elevation in the BF using the IP3R2flox mice. s Circadian variation of wakefulness in the two groups. n = 6 and 8 mice for Cre group and tdTomato group, respectively. t Percentage of wakefulness in the entire 24 h, during the day, during the night, and the early (ZT13–17) or late phase (ZT18–24) of the night. 24 h, P = 0.21; Day, P = 0.79; Night, *P = 0.049; ZT13–17, P = 0.90; ZT18–24, *P = 0.022; Student’s t-test.

