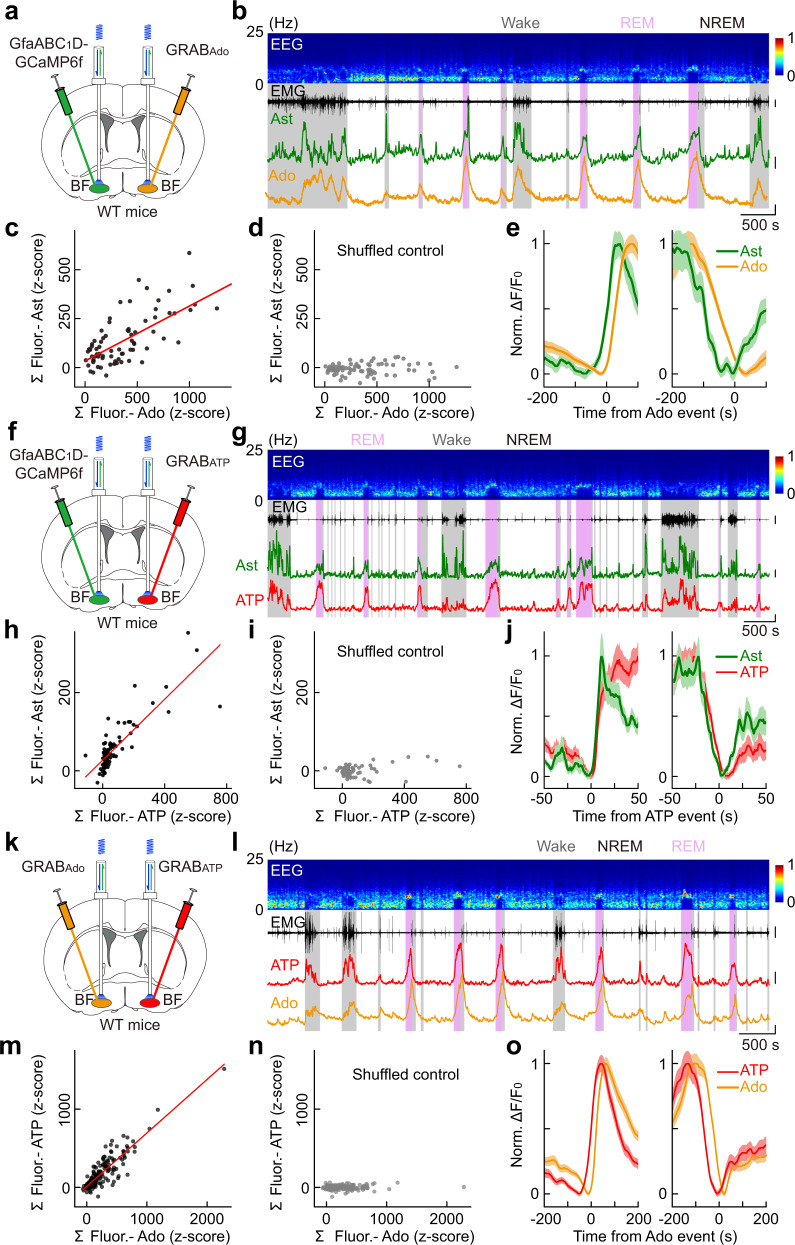
Fig. 4. Astrocyte Ca2+ elevation in the BF is highly correlated with the dynamics of extracellular adenosine and ATP levels.
a Schematic diagram depicting fiber photometry recording of extracellular adenosine level and population Ca2+ signal of astrocytes in the BF during the sleep–wake cycle. b Top to bottom, EEG power spectrogram, EMG (scale, 0.5 mV), GCaMP fluorescence (scale, 1 z-score), and GRABAdo fluorescence (scale, 1 z-score). c Correlation between the size of GCaMP and GRABAdo events. The red line represents a linear fit. n = 76 events from 7 recordings in 4 mice. Pearson’s r = 0.69, ***P < 0.001. d Same as in c after the GCaMP signal was randomly shuffled. Pearson’s r = 0.07. e Time course of the GCaMP and GRABAdo signal aligned to the onset (left) or offset (right) of the GRABAdo events. f–j Same as a–e, respectively, except that population Ca2+ signal of astrocytes and extracellular ATP were measured. Scale bar in g: EMG, 2 mV; GCaMP, 1 z-score; GRABATP, 1 z-score. In h: n = 88 events from 8 recordings in 4 mice. Pearson’s r = 0.84, ***P < 0.001. In I: Pearson’s r = 0.32. k–o Same as a–e, respectively, except that extracellular adenosine and ATP were measured. Scale bar in l: EMG, 0.5 mV; GRABAdo, 1 z-score; GRABATP, 1 z-score. In m: n = 199 events from 15 recordings in 4 mice. Pearson’s r = 0.89, ***P < 0.001. In n: Pearson’s r = 0.10.

