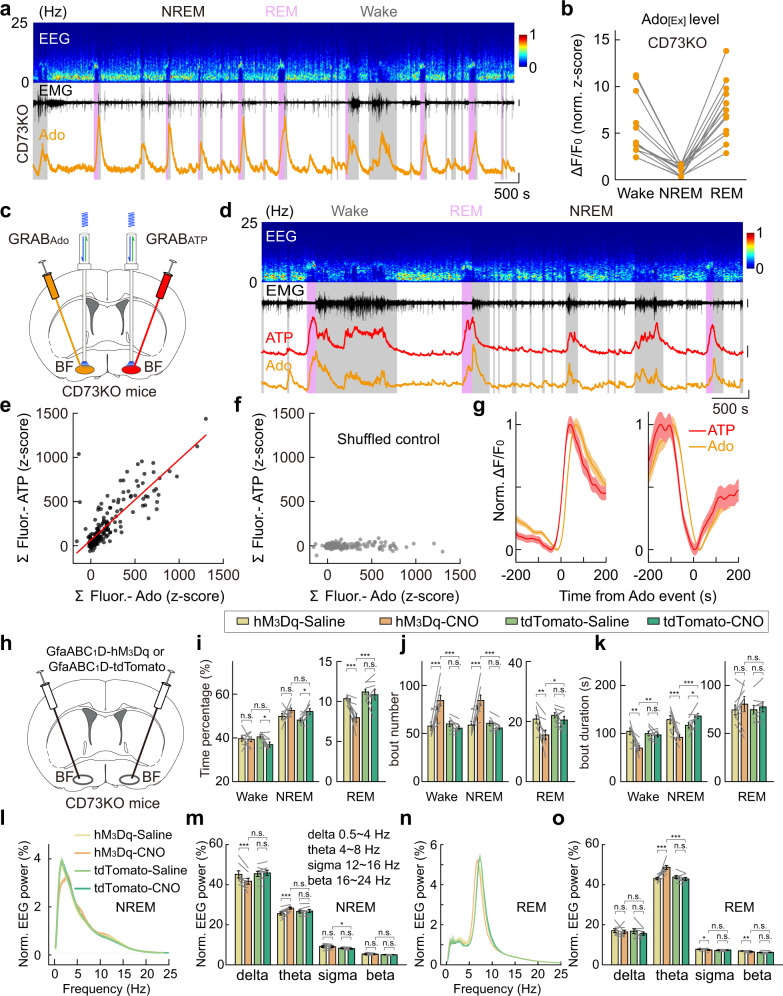
Fig. 5. CD73-KO mice show normal extracellular adenosine dynamics and astrocyte Ca2+ elevation-induced modulation to the sleep–wake cycle.
a Recording of adenosine signal in the BF during the sleep–wake cycle in CD73-KO mice. Top to bottom: EEG power spectrogram, EMG (scale, 1 mV), and GRABAdo fluorescence (scale, 1 z-score). b GRABAdo signal in CD73-KO mice in different brain states. Each line represents data from one recording. n = 13 sessions from 6 mice. CD73KO vs WT (reported previously in Fig. 4l in Peng et al.): Wake, P = 0.41; REM, P = 0.76; Wilcoxon rank-sum test. c–g Same as Fig. 4k–o, respectively, except that experiments were performed using CD73-KO mice. Scale bar in d: EMG, 1 mV; GRABAdo, 1 z-score; GRABATP, 1 z-score. In e: n = 187 events from 14 recordings in 4 mice. Pearson’s r = 0.83, ***P < 0.001. In f: Pearson’s r = 0.07. h–o Same as Fig. 3g–n, respectively, except that experiments were performed using CD73-KO mice. hM3Dq group, n = 8 mice; tdTomato group, n = 8 mice. The statistical method was two-way repeated measures ANOVA, followed by Tukey’s post hoc multiple comparison test. In i, hM3Dq-CNO vs tdTomato-CNO: Wake, P = 0.14; NREM, P = 0.78; REM, ***P < 0.001. hM3Dq-Saline vs hM3Dq-CNO: Wake, P = 0.85; NREM, P = 0.15; REM, ***P < 0.001. tdTomato-Saline vs tdTomato-CNO: Wake, *P = 0.035; NREM, *P = 0.042; REM, P = 0.51. In j, hM3Dq-CNO vs tdTomato-CNO: Wake, ***P < 0.001; NREM, ***P < 0.001; REM, *P = 0.017. hM3Dq-Saline vs hM3Dq-CNO: Wake, ***P < 0.001; NREM, ***P < 0.001; REM, **P = 0.0020. tdTomato-Saline vs tdTomato-CNO: Wake, P = 0.42; NREM, P = 0.38; REM, P = 0.30. In k, hM3Dq-CNO vs tdTomato-CNO: Wake, **P = 0.0028; NREM, ***P < 0.001; REM, P = 0.73. hM3Dq-Saline vs hM3Dq-CNO: Wake, **P = 0.0011; NREM, ***P < 0.001; REM, P = 0.21. tdTomato-Saline vs tdTomato-CNO: Wake, P = 0.75; NREM, *P = 0.022; REM, P = 0.52. In m, hM3Dq-CNO vs tdTomato-CNO: delta, P = 0.063; theta, P = 0.18; sigma, *P = 0.045; beta, P = 0.18. hM3Dq-Saline vs hM3Dq-CNO: delta, ***P < 0.001; theta, ***P < 0.001; sigma, P = 0.50; beta, P = 0.58. tdTomato-Saline vs tdTomato-CNO: delta, P = 0.54; theta, P = 0.62; sigma, P = 0.064; beta, P = 0.52. In o, hM3Dq-CNO vs tdTomato-CNO: delta, P = 0.53; theta, ***P < 0.001; sigma, P = 0.89; beta, P = 0.36. hM3Dq-Saline vs hM3Dq-CNO: delta, P = 0.47; theta, ***P < 0.001; sigma, *P = 0.023; beta, **P = 0.0076. tdTomato-Saline vs tdTomato-CNO: delta, P = 0.20; theta, P = 0.35; sigma, P = 0.28; beta, P = 0.69.

