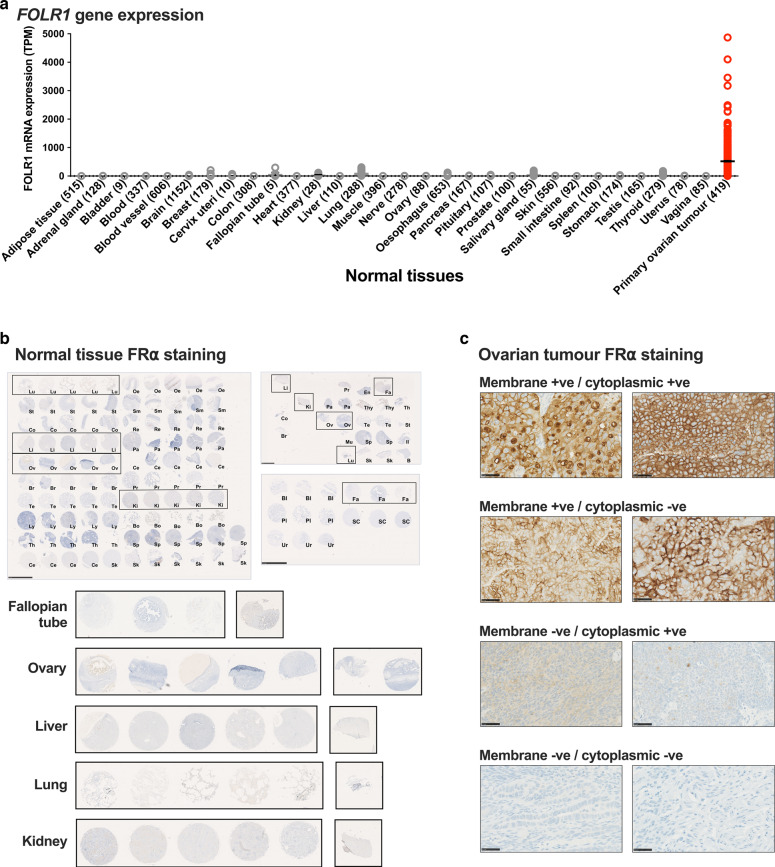
Fig. 2. Transcriptomic and immunohistochemical analyses of FRα expression in normal tissues and ovarian tumours.
a Low FOLR1 gene expression in normal tissues (grey) compared to primary ovarian tumours (red) (N numbers indicated in parentheses; The Human Protein Atlas online tool Xenabrowser online tool [35] (Xenabrowser.net). b No membrane or cytoplasmic FRα protein expression on a broad range of normal tissues (N = 142; scale bars = 2.5 mm). Key normal tissue types; fallopian tube (Fa), ovary (Ov), liver (Li), lung (Lu) and kidney (Ki) are highlighted with black boxes and zoomed images shown. c Representative images of ovarian tumour FRα staining (×40 magnification; scale bar = 50 μm). Bl bladder, Bo bone marrow, B brain, Br breast, Cb cerebrum; Ce cervix; Co colon; En endometrium, Fa fallopian tube, Il ileum, Ki kidney, Li liver, Lu lung, Ly lymph node, Mu muscle, striated, Oe oesophagus, Ov ovary, Pa pancreas, Pl placenta, Pr prostate, Re rectum, Sk skin, Sm small intestine, SC spinal cord, Sp spleen, St stomach, Te testis, Th thymus, Thy thyroid, Ur ureter.

