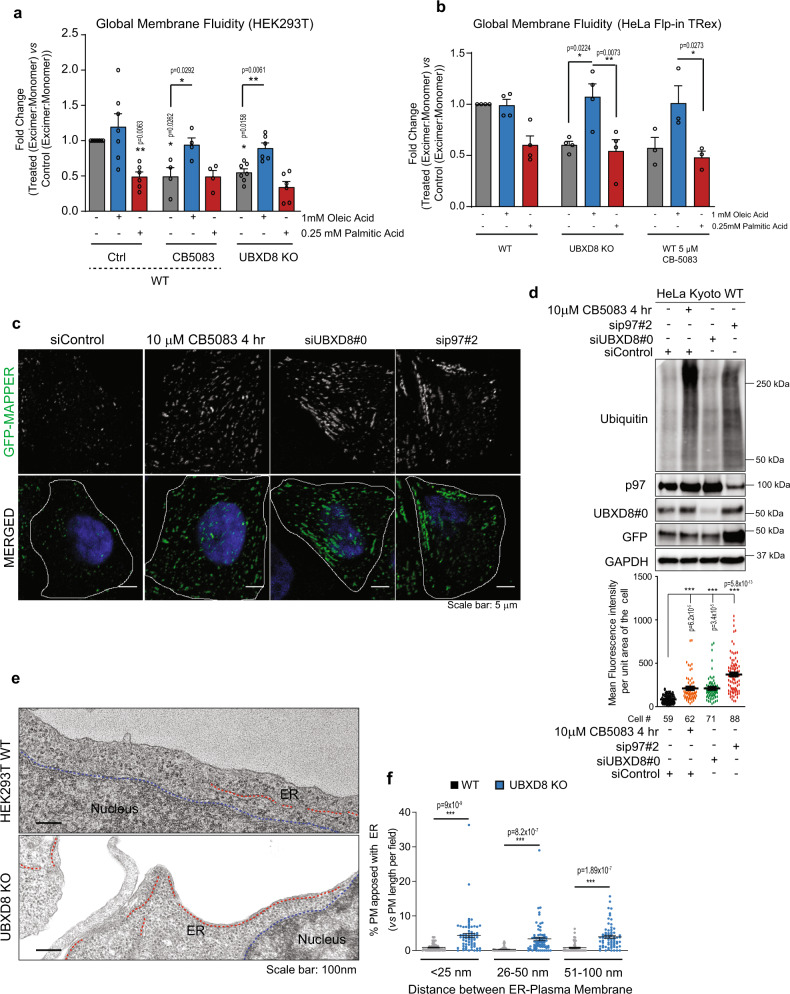
Fig. 7. Depletion of p97-UBXD8 alters global membrane fluidity and ER–PM contacts.
a, b Global membrane fluidity was measured using a pyrene-based lipid probe in wildtype and UBXD8 KO HEK293T cells (a) or HeLa-FlpIN-TRex cells (b). Wildtype cells were also treated with 5 μM of the p97 inhibitor CB-5083 for 4 h. Cells were supplemented with indicated concentrations of oleic acid and palmitic acid for 4 h. The fold change (Treatedexcimer:monomer vs Controlexcimer:monomer) of the ratio of excimer (Em. Max. 460 nm) to monomer (Em max. 400 nm) fluorescence is indicated. Fold changes <1 indicate more ordered lipid bilayers relative to wildtype untreated control. (For a: n = 8, 7, 6, 4, 4, 4, 7, 6, and 6 biologically independent samples from left to right, respectively; for b: n = 4, 4, 4, 4, 4, 4, 3, 3, and 3 biologically independent samples from left to right, respectively). c Representative fluorescence microscopy images showing the ER–PM contact sites reporter, GFP-MAPPER in HeLa Kyoto cells transfected with the indicated siRNAs for 48 h or treated with 10 μM CB5083 for 4 h. d Top: Immunoblot of indicated proteins; Bottom: Quantification of mean fluorescence intensity of GFP-MAPPER per unit area of cell for c. e Representative transmission EM micrographs of wildtype and UBXD8 KO HEK293T cells illustrating contacts between ER (red dotted line) and plasma membrane. Nucleus boundary is marked by blue dotted line. f Quantification of contact length between ER and plasma membrane in each genotype from e (measurements are from n = 3 biological replicates with WT = 50 cells from 65 fields and UBXD8 KO = 53 cells from 71 fields). Data are means ± SEM. *, **, ***P < 0.05, 0.01, 0.0001, respectively. Significance was analyzed by one-way ANOVA with Tukey’s multiple comparison test (a, b, d, f) or one-tailed Student’s t test for columns in a. Source data are provided as a Source data file.

