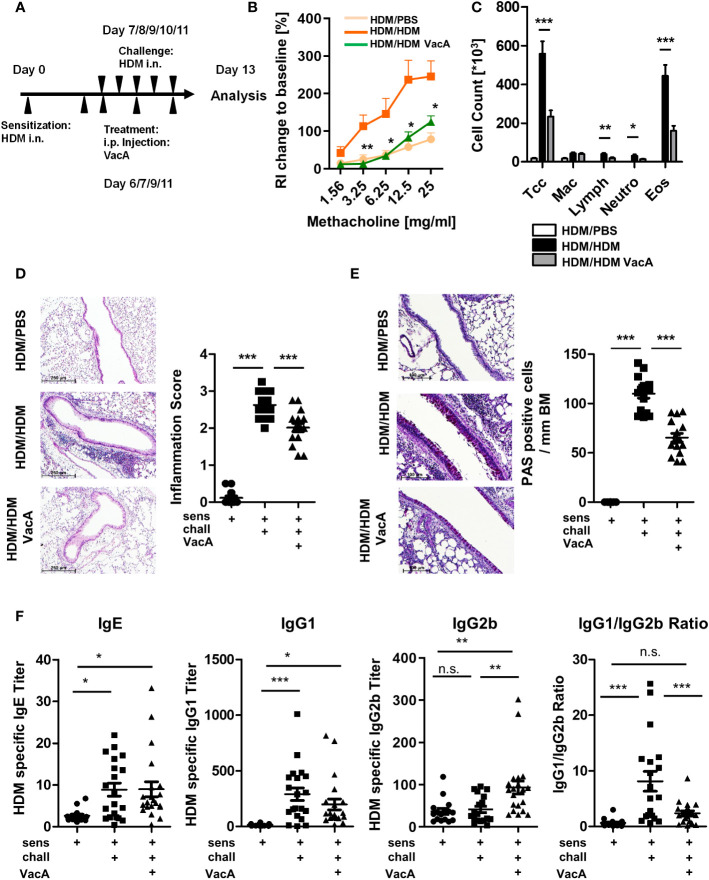
Figure 1.
VacA treatment attenuates the asthma phenotype. (A) Animals were sensitized (day 0) and challenged intranasally (day 7–11) with house dust mite (positive control, HDM/HDM). VacA (HDM/HDM VacA) was given intraperitoneally (i.p.) on days 6, 7, 9 and 11. Phosphate-buffered saline (PBS)-challenged animals served as negative controls (HDM/PBS). (B) Change of airway resistance (RI): percentage change of airway resistance in response to increasing doses of methacholine vs. PBS; HDM/HDM (dark orange), HDM/HDM VacA (green) and HDM/PBS mice (light orange). Asterisks indicate difference between HDM/HDM and HDM/HDM VacA. (C) Cellular composition of bronchoalveolar lavage (BAL): total cell count (Tcc), macrophages (Mac), lymphocytes (Lymph), neutrophils (Neutros) and eosinophils (Eos); HDM/HDM (black), HDM/HDM VacA (dark gray) and HDM/PBS mice (white). (D) Inflammation in lung tissue: pictures show representative sections of each indicated group (x100). Scatter plot: inflammation score in HDM/PBS, HDM/HDM and HDM/HDM VacA animals. (E) Mucus-producing cells: pictures show representative sections from each group (x200). Scatter plot: number of mucus-producing cells/mm basement membrane in HDM/PBS, HDM/HDM and HDM/HDM VacA animals. (F) VacA treatment affects immunoglobulin subtypes. Graphs: house dust mite (HDM)-specific immunoglobulin (Ig)E, -IgG1, -IgG2b titers and ratio of HDM IgG1 to IgG2b in HDM/phosphate-buffered saline (PBS), HDM/HDM and HDM/HDM VacA animals. (B, C) results from five independent experiments, n=15–20 per group. (D–F) each symbol represents one animal. (D, E) results from four independent experiments, n=12–16 per group. (F) Results from five independent experiments, n=16–21 per group. Analysis of variance: *p<0.05, **p<0.01, ***p<0.001; ns, not significant.

