Figure 2.
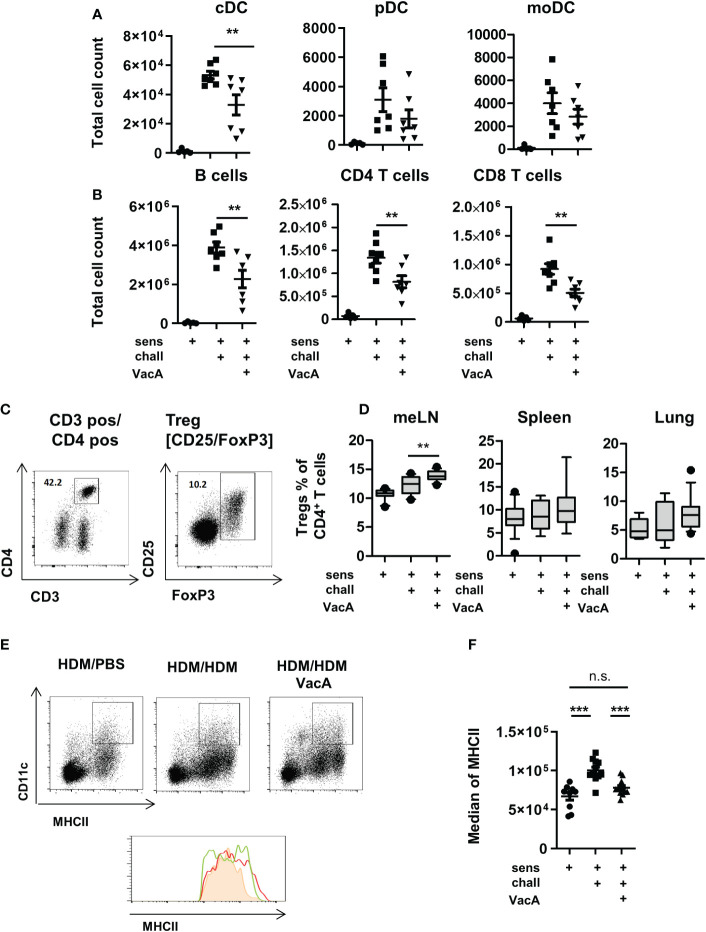
VacA treatment affects immune phenotype. Total cell counts of (A) conventional dendritic cells (cDC), plasmacytoid DC (pDC) or monocyte-derived inflammatory DC (moDC) and (B) B cells. CD4+ and CD8+ T cells in lung draining lymph nodes (tLN) of house dust mite (HDM)/phosphate-buffered saline (PBS), HDM/HDM and HDM/HDM VacA animals. (C, D) VacA treatment increases proportion of Tregs. (C) Tregs were characterized by the expression of FoxP3 within the population of CD3+/CD4+ T helper cells. (D) Boxplots (Whiskers 10-90 percentile) show percentage of Tregs within the population of CD4+ T cells in mesenteric lymph nodes (meLN), Spleen and tLN of HDM/PBS, HDM/HDM and HDM/HDM VacA animals. (E, F) DC in VacA-treated animals showed reduced major histocompatibility complex II (MHCII) expression in draining lymph nodes. (E) Representative dot plots show MHCII/CD11c expressing DC in draining lymph nodes of HDM/PBS, HDM/HDM and VacA-treated HDM/HDM mice. Histogram shows MHCII expression in HDM/PBS (shaded orange), HDM/HDM (red line) and HDM/HDM VacA animals (green line). (F) Graph shows median MHCII expression on DC in the draining lymph nodes of HDM/PBS, HDM/HDM and HDM/HDM VacA-treated mice. Each point represents one animal. (A, B) results from two independent experiments, n=5–7 per group. (C, D) results from 3–5 independent experiments, n=10–21 per group. (E, F) results from three independent experiments, n=9–12 per group. Analysis of variance: *p<0.05, **p<0.01, ***p<0.001.

