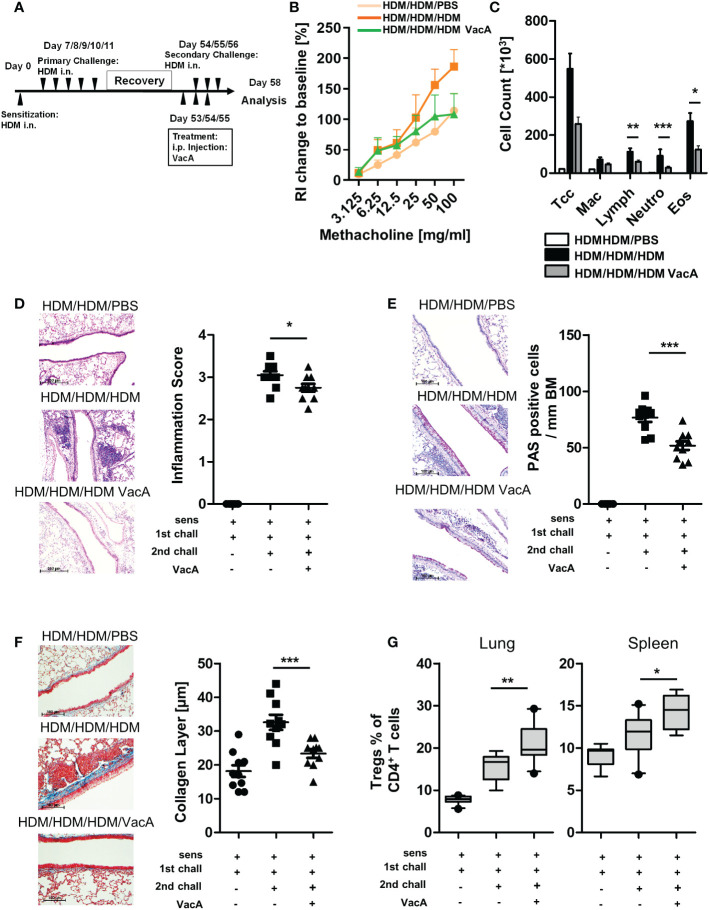
Figure 4.
VacA attenuates asthmatic reactions in mice with already established lung disease. (A) secondary allergen challenge was performed after house dust mite(HDM) sensitization and challenge, and 6 weeks’ rest. VacA treatment was given during the secondary challenge. (B) Change of airway resistance (RI):percentage change in airway resistance in response to increasing doses of methacholine vs. PBS; HDM/HDM/HDM (dark orange), HDM/HDM/HDM VacA(green) and HDM/HDM/PBS mice (light orange) (C) Cellular composition of BAL: number of total cells (Tcc), macrophages (Mac), lymphocytes (Lymph),neutrophils (Neutro) and eosinophils (Eos); negative control (HDM/HDM/PBS [white]), positive control (HDM/HDM/HDM [black]) and HDM/HDM/HDMVacA (dark gray). (D) Inflammation in lung tissue: pictures show representative sections from each indicated group (x100). Scatter plot: inflammationscore in HDM/HDM/PBS, HDM/HDM/HDM and HDM/HDM/HDM VacA mice. (E) Mucus-producing cells in lung airways: pictures show representativesections from each group (x200). Scatter plot: number of mucus-producing cells/mm basal membrane of HDM/HDM/PBS, HDM/HDM/HDM and HDM/HDM/HDM VacA mice. (F) Subepithelial collagen deposition: pictures show representative sections from each group (x200). Scatter plot: averagedsubepithelial collagen layer thickness in μM in HDM/PBS, HDM/HDM and HDM/HDM VacA animals. (G) VacA treatment increases Treg frequencies.Boxplots (Whiskers 10-90 percentile) show proportion of Tregs within the population of CD4-positive T cells in the lung and spleen of HDM/HDM/PBS,HDM/HDM/HDM and HDM/HDM/HDM VacA animals. Each symbol represents one animal. Data are results from two independent experiments, n=10 per group. Analysis of variance: *p<0.05, **p<0.01, ***p<0.001.

