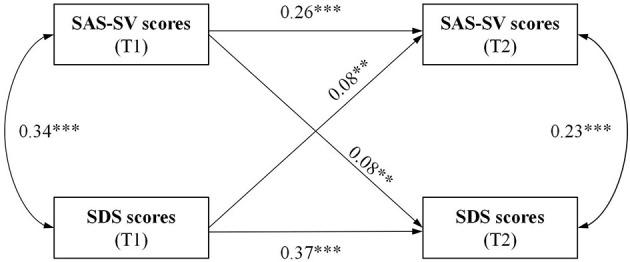
Figure 1.

CLPM of SAS-SV and SDS scores at baseline (T1) and follow-up (T2, over 12 months) with standardized path coefficients. **P < 0.01; ***P < 0.001; T1 = assessed at baseline, T2 = assessed at follow-up. SAS-SV, Smartphone Addiction Scale-Short Version; SDS, Zung's Self-Rating Depression Scale; Single-headed arrows denote regressions, double-headed arrows denote correlations.
