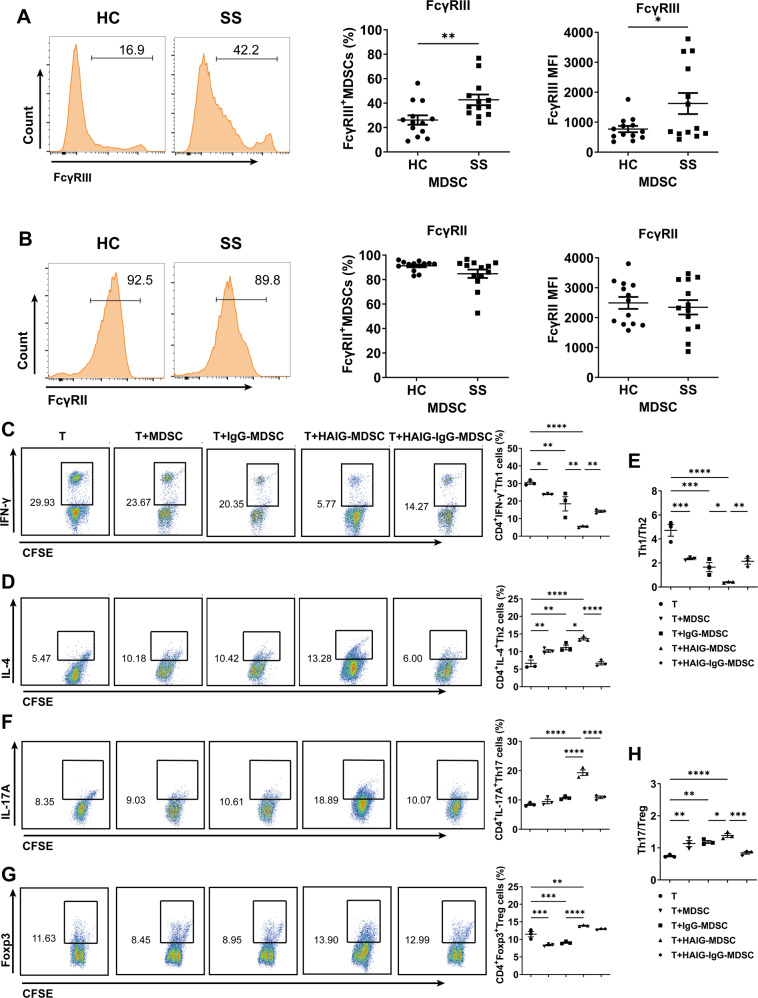
Fig. 3. FcγRIIIA activated MDSCs disturbed the balances of Th1/Th2 and Th17/Treg cell subsets.
A, B FcγRIII and FcγRII on peripheral MDSCs (HC n = 13, SS n = 13) were detected by flow cytometry. Representative flow cytometric analysis and percentages of FcγRIII+ MDSCs and FcγRII+ MDSCs and the MFI of FcγRIII and FcγRII on MDSCs from HC and SS patients were shown. C–H MDSCs or IgG-preprocessed MDSCs were stimulated with or without IgG or HAIG for 24 h and then co-cultured with CFSE-labeled CD4+ T cells for 72 h. Representative flow cytometric analysis and percentages of CD4+ T cell subsets were shown. C CD4+IFN-γ+ Th1 cells, D CD4+IL-4+ Th2 cells, E the ratio of Th1/Th2, F CD4+IL-17A+ Th17 cells, G CD4+Foxp3+ Treg cells, H the ratio of Th17/Treg. All the data are representative of two independent experiments. n = 4, *p < 0.05, **p < 0.01, ***p < 0.001, ****p < 0.0001.

