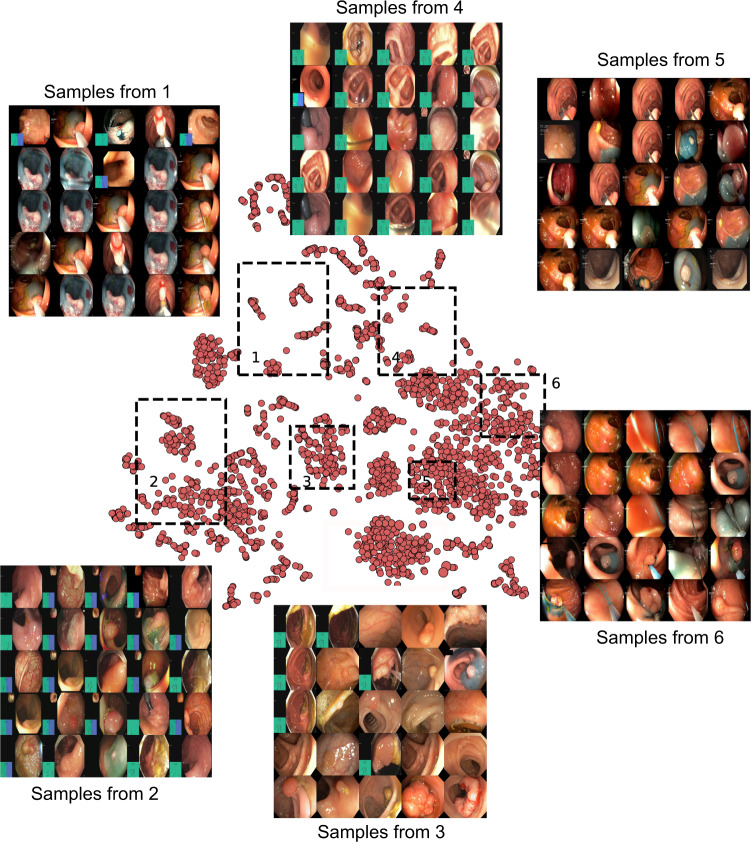
Fig. 1.
t-SNE plot for positive samples: 2D t-SNE embedding of the “PolypGen” dataset based on deep autoencoder extracted features. Each point is an image in the positive samples of the dataset. For each of the six boxed regions (dashed black lines) 25 images were randomly sampled for display in a 5 × 5 image grid. Here, the 1st boxed region represents mostly the sequence data. Interestingly, the 3rd, the 4th, and the 6th boxed regions mostly represent both polyp and non-polyp data and heterogeneously distributed. Samples from 2nd and the 5th boxed regions shows mostly protruded polyps but with differently positioned endoscopy locations. Some samples in these also include the colonoscopy frames with dyes.

