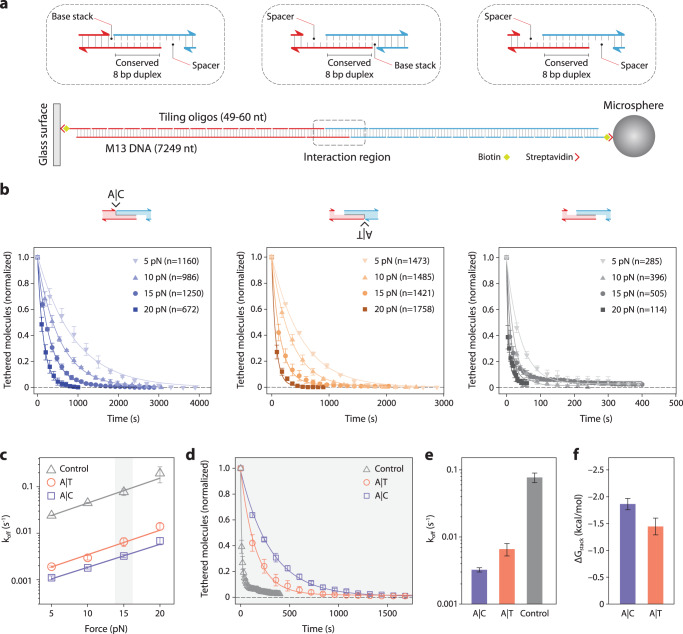
Fig. 3. Experimental measurement of single base stacking energies.
a A weak central 8 bp duplex is designed to be flanked by a terminal base stack or no base stacks. The central interaction is formed between two DNA handles attached to a glass slide and a microsphere through biotin-streptavidin interaction. b Raw data and single-exponential fits obtained for the A|C, A|T and control constructs at forces from 5 to 20 pN. c Force-dependent off-rates fit with the Bell-Evans model (solid lines) to determine thermal off-rate. Force scales determined as 8.8 ± 0.7 pN (A|C), 8.3 ± 1.0 (A|T), and 8.1 ± 0.2 (control), corresponding to transition state distances of 0.47 ± 0.04 nm, 0.49 ± 0.05 nm, and 0.51 ± 0.01 nm, respectively. d Analysis of the three constructs at 15 pN shows clear differences in dissociation, fit with exponential decay curves to yield off-rates (e), from which ΔGstack is calculated (f). Data in (b–e) presented as mean values +/− standard deviation from three independent data sets (shown in Supplementary Figs. 2–4). Data in (f) calculated from mean values +/− propagated errors from (e). n represents the number of individual molecular tethers.

