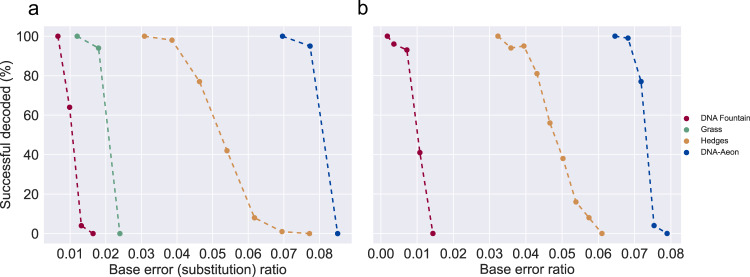
Fig. 1. Base error ratio comparison: percentage of successful decoding attempts for a given base error (substitution) ratio (a) and percentage of successful decoding attempts for a given base error ratio (b), using the proportions of substitutions, deletions and insertions described in12 (high mutagenesis), with a multiplier between 0.1 and 2.2.
The output constraints used were a maximum homopolymer length of 3 and, for the codes that support it, a GC content between 40 and 60% in 10 nt intervals. The last ratio, in which the code had a 100% success rate (out of 100 repetitions) and up until the first time, the code had a zero percent success rate, is shown for each code. Points represent the results of the simulations, while dashed lines are interpolated values. Source data are provided as a Source Data file.

