Figure 2.
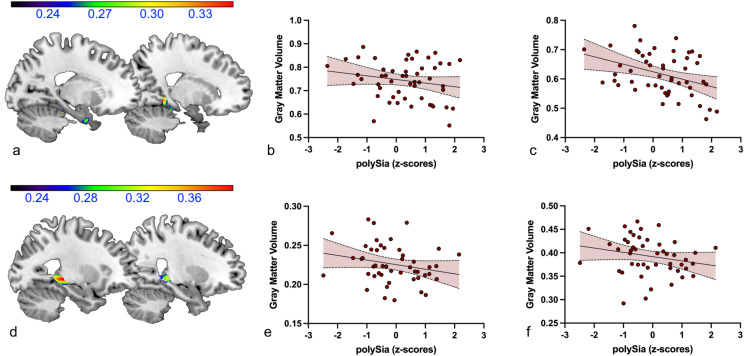
Negative association between polySia serum levels and bilateral parahippocampal gray matter volume in patients with SZ/SZA (a–c) and BD (d–f) (a) Sagittal views (x = − 20, x = 18) of the significant clusters depicting gray matter volumes correlating with polySia levels in SZ/SZA patients. (b) Scatter plot depicting the negative correlation (r = − .199, p = .025) of polySia levels and the peak voxel value (x = − 20, y = 0, z = − 32) of the cluster shown in A on the left. (c) Scatter plot depicting the negative correlation (r = − .372, p = .010) of polySia levels and the peak voxel value (x = 18, y = -42, z = −6) of the cluster shown in A on the right. (d) Sagittal views (x = -21, x = 26) of the significant clusters depicting gray matter volumes correlating with polySia levels in BD patients. (e) Scatter plot depicting the negative correlation (r = − .231, p = .004) of polySia levels and the peak voxel value (x = − 27, y = − 30, z = − 3) of the cluster shown n in (d) on ther left. (f) Scatter plot depicting the negative correlation (r = − .220, p = .013) of polySia levels and the peak voxel value (x = 26, y = − 32, z = − 2) of the cluster r shown in (d) other right. Color bars: negative correlation coefficient − r.

