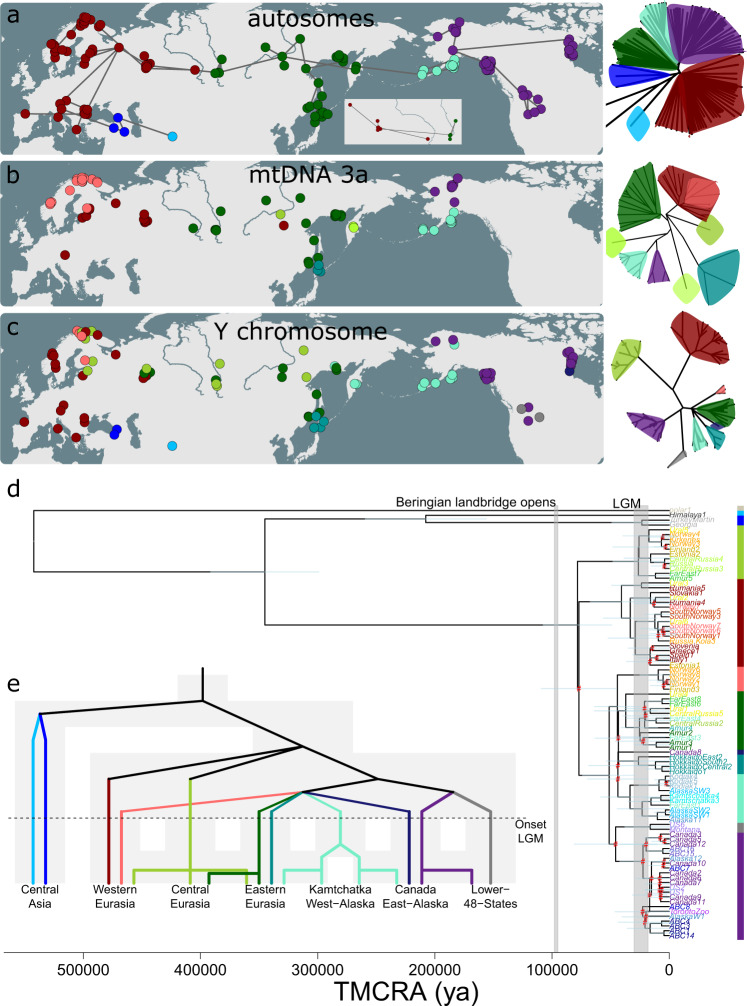
Fig. 2. Spatial distribution of genetic clusters, depicting the (in)consistencies between markers, possibly partly caused by incomplete lineage sorting.
Geographical distribution of individuals, with colour coding according to genetic cluster instead of population assignment. a Geographical map showing hierarchical clustering (using bioNJ method) of brown bear individuals based on Euclidean distances for autosomal SNP data. Lines connecting samples represent a minimum spanning tree (generated with the function ‘mst’ of the R-package ‘ape’), based on allele sharing distances. Inset: detail of minimum spanning tree in central Russia, which highlights that the transition in western Siberia between the western (red) and eastern (darkgreen) Eurasian clades is abrupt rather than gradual. b Geographical map showing the distribution of variants of mtDNA haplotype clade 3a, according to a maximum likelihood phylogeny generated with the software IQtree. c Geographical map showing the distribution of Y chromosome haplotypes (see d). d Rooted Y-chromosomal maximum-likelihood phylogeny, generated with the software IQtree. The phylogeny has been linearised using the mean path length method, and branch lengths have been converted in TMCRA-estimates assuming a mutation rate of 1.3 × 10⁻⁹ per site per year. Lightblue bars indicate confidence intervals of the node ages. Nodes with ultrafast bootstrap support values below 0.95 are highlighted in red. The colour bar on the righthand side corresponds to the genetic clusters in Fig. 2c. The tip colour coding (sample names) corresponds to population assignment as in Fig. 1. e Speculative model on Y-chromosomal phylogeography, with background grey shaded areas depicting population connectivity. Colours correspond to genetic clusters in Fig. 2c.

