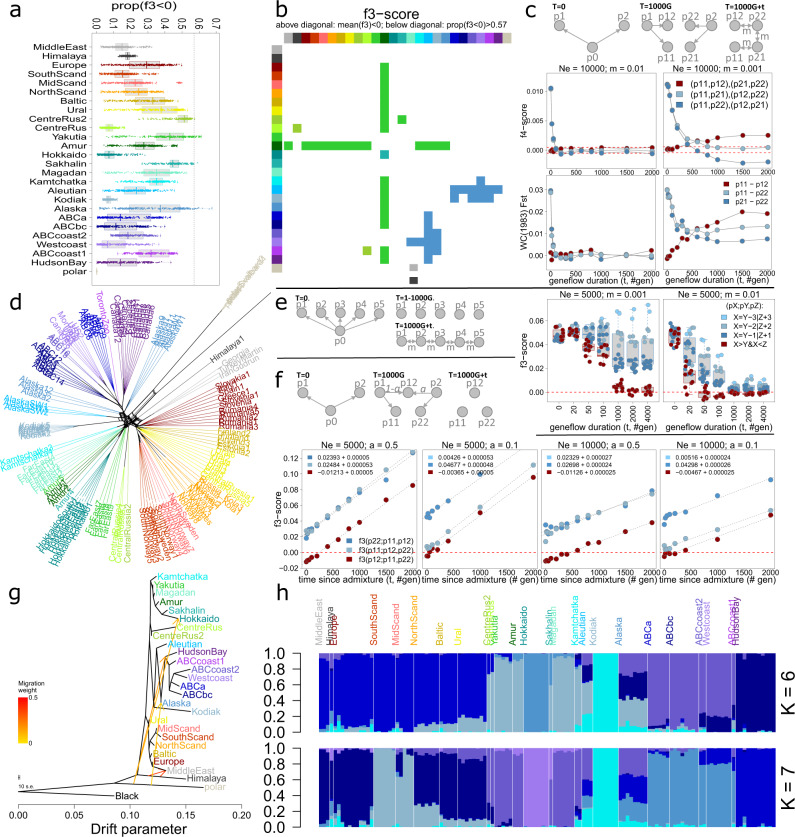
Fig. 4. Admixture analyses suggest hybridisation zones in Alaska and eastern Siberia (‘Yakutia’).
a Boxplots with overlaying stripcharts, depicting for all 7800 population triplets (A;B,C) the proportion of 50 Kb windows with a f3-score below zero, with the putatively admixed population A along the y-axis. The dashed line denotes an arbitrary cut-off at 0.57. b Matrix highlighting population triplets with negative genome-wide f3-score (above diagonal) or high proportions (>0.57) of 50 Kb windows with a negative f3-score (below diagonal), for all populations triplets (A;B,C). Colours along the x- and y-axes represent donor population B and C, while field colours denote admixed population A (i.e., Yakutia, Alaska, Sakhalin and CentreRus2). c Consistent with expectations, SLIM2 genetic forward-in-time simulations indicate that signals of former population structure (here estimated using f4- and FST-estimates) are lost in approximately 1/m generations, with m, migration rate, denoting the proportion of individuals that are immigrants. Initially, population p12 clusters with sister population p11, but gene flow ultimately causes p12 to cluster with unrelated population p22. d Phylogenetic network constructed with the ‘Neighbor-Net’ algorithm, based on genome-wide uncorrected genetic distances. The tiplabels of the outgroup (American black bears) are not shown. Polar bears cluster either with black bears or North American brown bears. Bears from the Middle East cluster either with European bears or Himalayan bears. Southwestern Alaskan (‘Aleutian’) bears cluster either with Alaskan bears or Kodiak bears. e SLIM2 simulations indicate that negative f3-scores can arise as a result of isolation-by-distance. f SLIM2 simulations indicate that, as a result of genetic drift, f3-scores increase every generation with a fixed value of ¼Ne, causing evidence of past pulse admixture events to eventually disappear. g Treemix maximum likelihood phylogeny with the four strongest admixture edges. Consistent with MSC-based analyses (Fig. 5A), the admixture edges suggest gene flow from Himalayan bears into Syrian bears (Middle East), as well as gene flow from polar bears into Hokkaido and North American brown bears. h Stacked barplots, generated with the R package LEA, depicting inferred ancestry coefficients assuming 6 or 7 ancestral populations. For each pair of closely related individuals, only one individual was included in the analysis.

