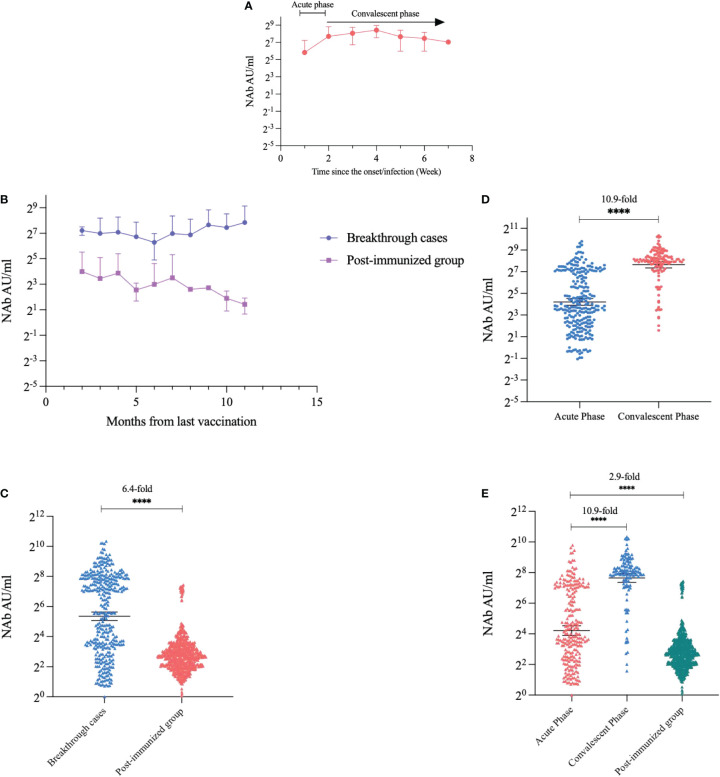
Figure 2.
Kinetics and quantitative comparison of NAb levels over time. (A) Trends in NAb after the onset of breakthrough cases. (B) Trends in NAbs in breakthrough cases and post-immunized groups with time since the last vaccination. (C) Comparison of NAbs quantification in breakthrough cases and post-immunized group. (D) Comparison of NAbs in the acute phase and convalescent phase of breakthrough cases. (E) Comparison of NAbs in the acute phase, convalescent phase, and post-immunized group. Dark horizontal lines for each group denote sample medians, and the error bars and dotted lines indicate the interquartile range. ****P < 0.0001.

