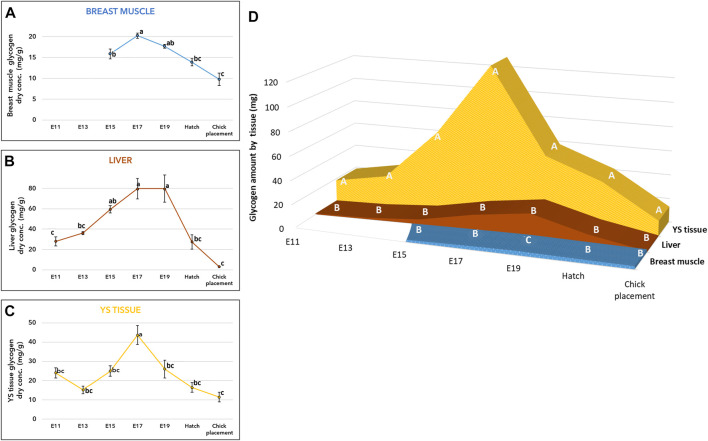
FIGURE 2.
Glycogen levels from E11 until hatch and at chick placement (A–C) Dry weight concentration (mg/g) and (D) total tissue amount (mg) of YS tissue, liver, and breast muscle (A–C) The lower-case letters denote for means significantly different between days within each organ, as derived from a one-way ANOVA Tukey’s HSD test (D) The capital letters denote for means significantly different between organs within each day as derived from a two-way ANOVA followed by Tukey’s HSD test. (p ≤ 0.05), n = 6 per day.

