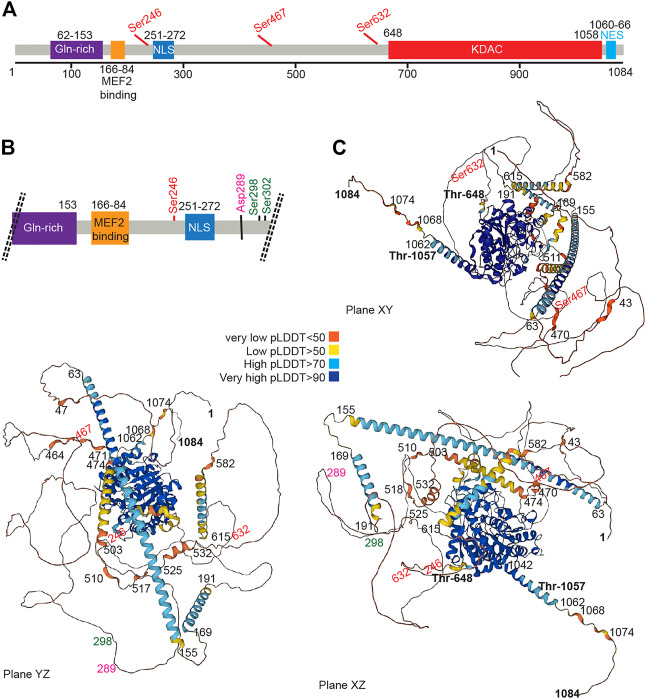
FIGURE 2.
The HDAC4 protein. (A) Schematic view of the HDAC4 protein. The major domain and regulative aa sites are highlighted. (B) Schematic view at higher magnification of the N-terminal region of HDAC4. (C) AlphaFold prediction of HDAC4 structure. Three different views are provided. Colors indicate the different per-residue confidence score (pLDDT) as indicated. Some regions below 50 pLDDT may be unstructured in isolation. https://alphafold.ebi.ac.uk/entry/P56524.

