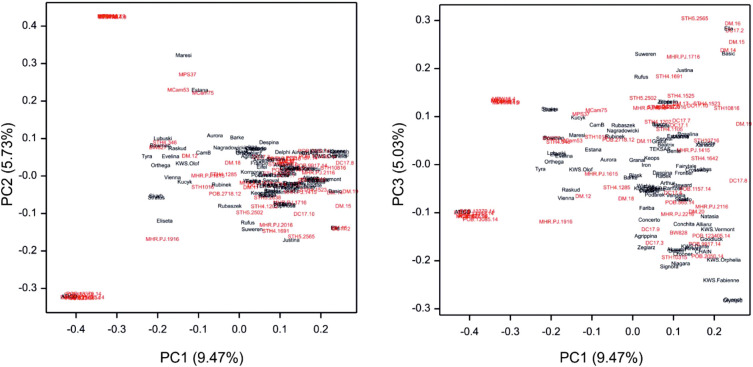
Figure 4.
Visualization of the population structure by PCoA of the kinship coefficient matrix for accessions (cultivars – black, breeding lines – red) based on SNP markers. Cultivar accessions were grouped on the right side and evenly distributed groups of breeding lines overlapped with the subgroups of cultivars.

