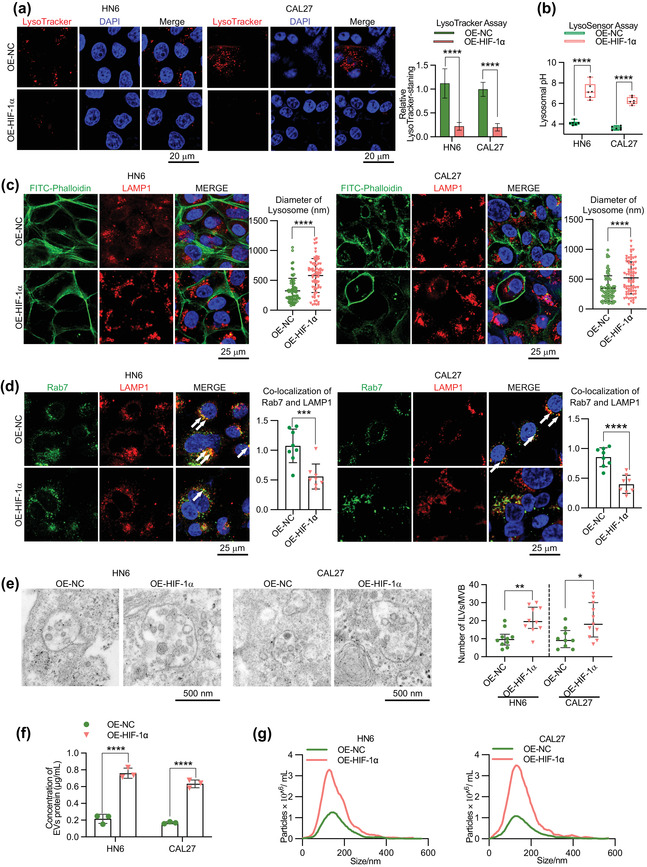
FIGURE 7.

Accumulation of HIF‐1α can impair lysosomes and promote EV secretion. (a) OE‐NC and OE‐HIF‐1α cells were stained with Lysotracker Red and Lysotracker+ dots were quantified. Scale bar, 20 μm. (b) Lysosomal pH of OE‐NC and OE‐HIF‐1α cells was determined by Lysosensor assay. (c) Confocal microscopy analysis of LAMP1 in OE‐NC and OE‐ HIF‐1α cells to assess the size of lysosomes. Scale bar, 25 μm. The right graph shows the distribution of the lysosomal diameter (n > 70 per group). (d) Confocal co‐localization analysis of LAMP1 and Rab7 in OE‐NC and OE‐HIF‐1α cells. Scale bar, 25 μm. The ratio of co‐localization of LAMP1 and Rab7 was quantified (n > 10 per group). (e) Electron microscopy images showing MVBs in OE‐NC and OE‐HIF‐1α cells. Right graph: quantification of ILV number per MVB. Each dot represents the number of ILVs per MVB (n > 10 per group). Scale bar, 500 nm. (f) The EVs were collected from equal numbers of OE‐NC/OE‐HIF‐1α cells and concentration of EV protein was measured using BCA assay. (g) The size and quantity of EVs from OE‐NC/OE‐HIF‐1α cells were measured using NTA. EVs were collected from 20×106 cells for each group. Statistical analyses were performed using t‐test. * P‐value < 0.05. ** P‐value < 0.01, *** P‐value < 0.001, **** P‐value < 0.0001. Data are presented as the mean ± S.D.
