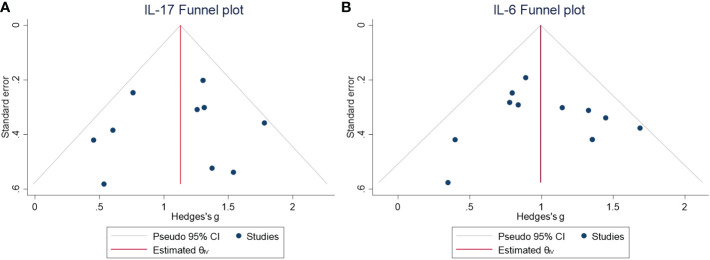
Figure 4.
(A) Funnel plot for the meta-analysis of the IL-17 level in the CSF of NMDAR-E vs. control. (B) Funnel plot for the meta-analysis of the IL-6 level in the CSF of NMDAR-E vs. control. CSF, cerebrospinal fluid; NMDAR-E, anti-N-methyl-D-aspartate receptor encephalitis; IL, interleukin; CI, confidence interval.

