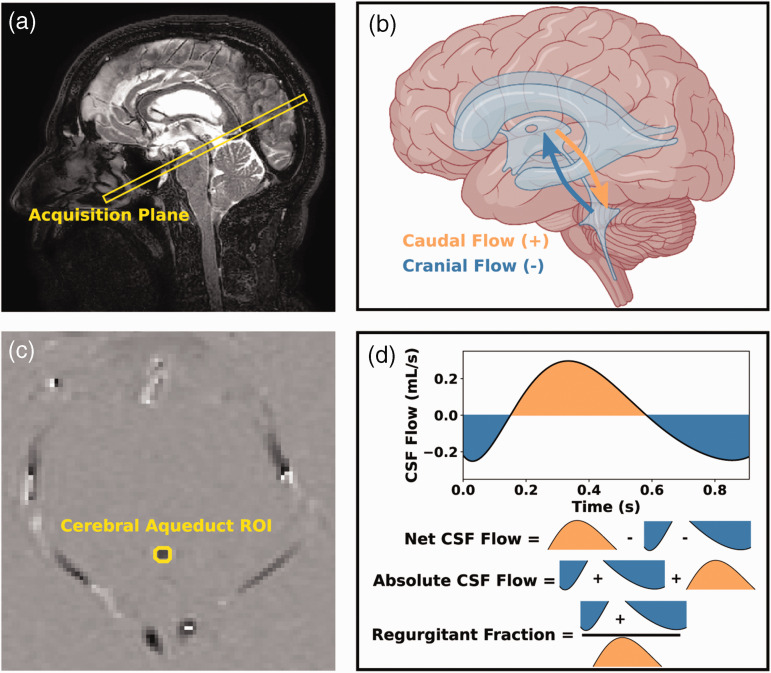
Figure 2.
Overview of phase contrast acquisition. The imaging slice was planned orthogonal to the cerebral aqueduct of Sylvius (a: sagittal T2-weighted image at midline). The direction of the bipolar, velocity sensitizing gradients was set to foot-head, but post-processing methods designated caudal flow with positive phase (b: orange) and cranial flow with negative phase (b: blue). A mask was drawn around the aqueduct of Sylvius to extract the phase values from that region (c: subtracted phase image), and these phase values were used to generate cerebrospinal fluid (CSF) flow curves and calculate the following metrics: net CSF flow, absolute CSF flow, and regurgitant fraction (d). Example data are shown from a 66-year-old male. (ROI: region of interest; CSF: cerebrospinal fluid; HR: heart rate).

