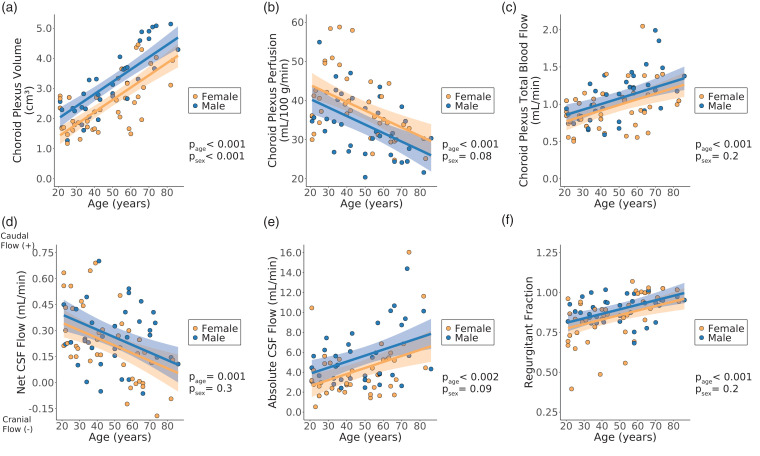
Figure 4.
Results from choroid plexus regression analyses with volume (a), perfusion (b), and total blood flow (c) as the response variable and cerebrospinal fluid (CSF) regression analyses with net CSF flow (d), absolute CSF flow (e), and regurgitant fraction (f) as the response variable (Wald test significance criteria: p < 0.05). Generalized linear models were implemented with age and sex as explanatory variables. Shaded regions represent the 95% confidence interval for the fitted data based on the standard error of the prediction. All p-values shown were corrected for multiple comparisons. (CSF: cerebrospinal fluid; page: p-value for age coefficient in generalized linear model; psex: p-value for sex coefficient in generalized linear model).

