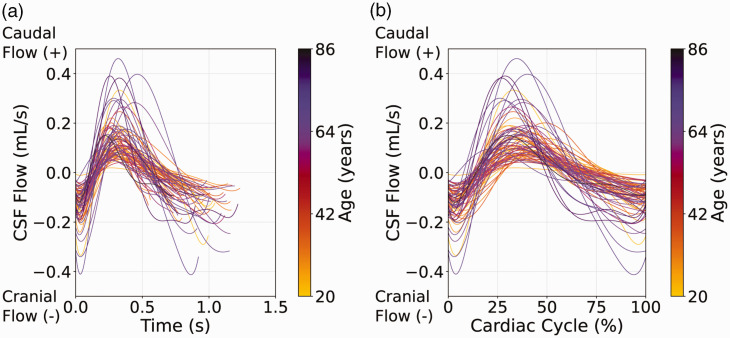
Figure 5.
Cerebrospinal fluid (CSF) flow results. CSF flow curves for all participants, color-coded by age, are shown, with time of the cardiac cycle (a) and fraction of the cardiac cycle (b) displayed on the x-axes. As the age of participants increased, the peak-to-peak difference in the CSF flow curves increased. With increasing age, net CSF flow decreases, absolute CSF flow increases, and regurgitant fraction increases. (CSF: cerebrospinal fluid).

