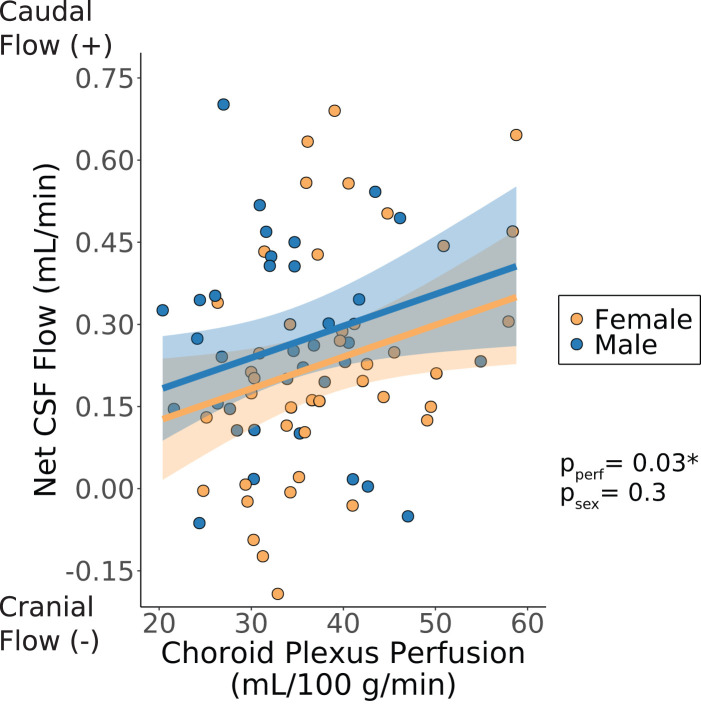
Figure 6.
Net cerebrospinal fluid (CSF) flow versus choroid plexus perfusion; choroid plexus perfusion and sex are considered as explanatory variables (Wald test significance criteria: p < 0.05). Shaded regions represent the 95% confidence interval for the fitted data based on the standard error of the predictions. All p-values shown were corrected for multiple comparisons correction unless noted otherwise. * Signifies that the p-value for the choroid plexus perfusion coefficient was statistically significant before but not after multiple comparisons correction. (CSF: cerebrospinal fluid; pperf: p-value for choroid plexus perfusion coefficient in generalized linear model; psex: p-value for sex coefficient in generalized linear model).

