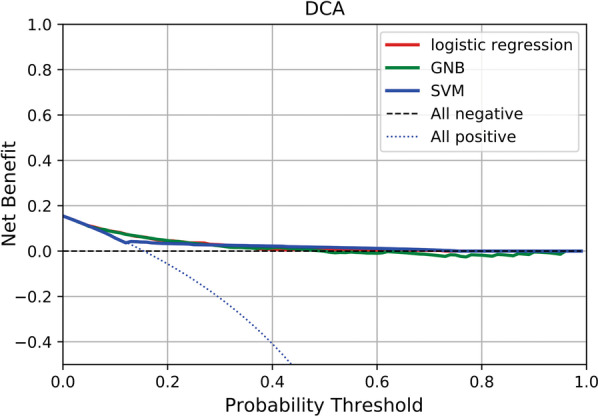
Fig. 5.

Decision curve analysis showing the clinical application value of LR, GNB and SVM models in predicting hospital mortality. The y-axis represents the net benefit; The x-axis represents the threshold probability. The blue dotted line represents the net benefit of providing all participants similar treatment, assuming that all would die. The black dotted line represents the assumption that all patients survive. The Red solid, green solid, and blue solid lines represent the net benefit of predicting the risk of in-hospital death according to LR, GNB, and SVM models, respectively. LR logistic regression analysis, GNB Gaussian Naive Bayes, SVM support vector machines
