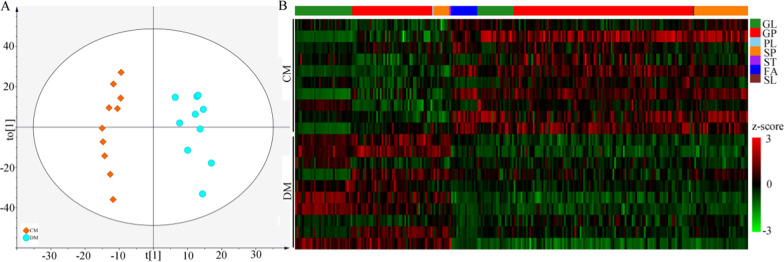
Fig. 5.
Differential liver lipid metabolites between the two groups. A The scatter plot of OPLS-DA mode indicated that there were divergent metabolic phenotypes between DM (n = 10) and CM (n = 10) (see the explanations of t [1] and to [1] in Additional File 1); B The heat-map was built using the normalized abundance score for each differential metabolites. DM depressed mice, CM control mice, GL Glycerolipids, GP Glycerophospholipids, PL Prenol lipids, SP Sphingolipids, ST Steroids and steroid derivatives, FA Fatty acids, SL Saccharolipids

