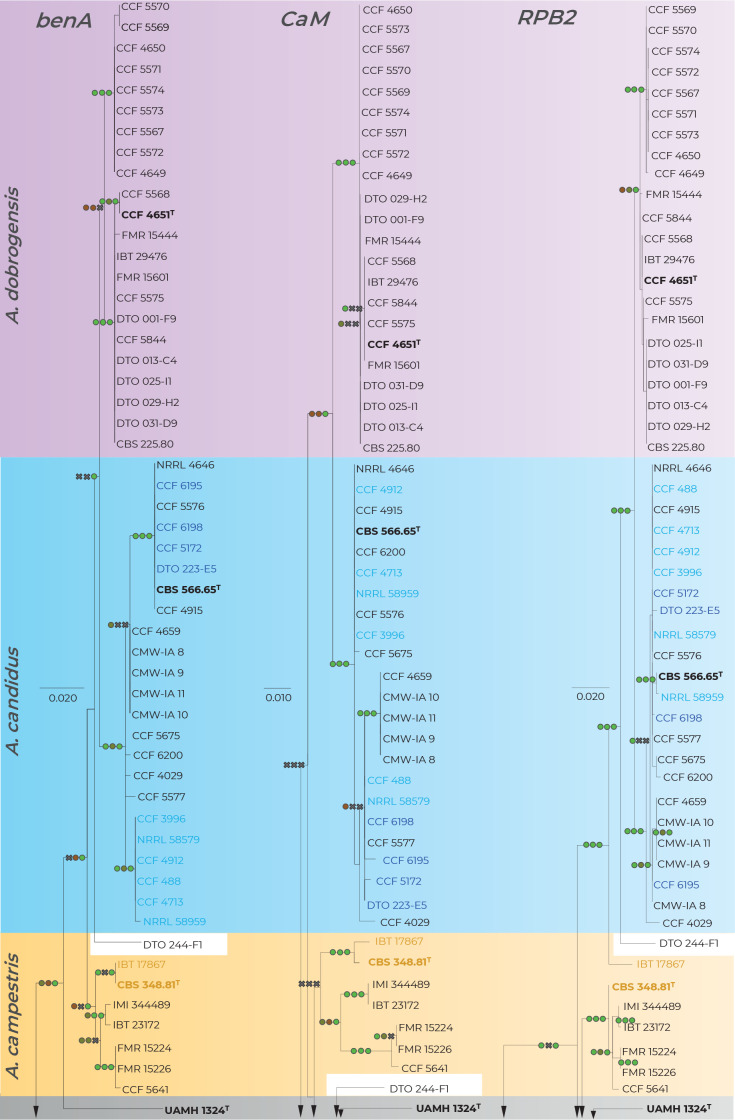
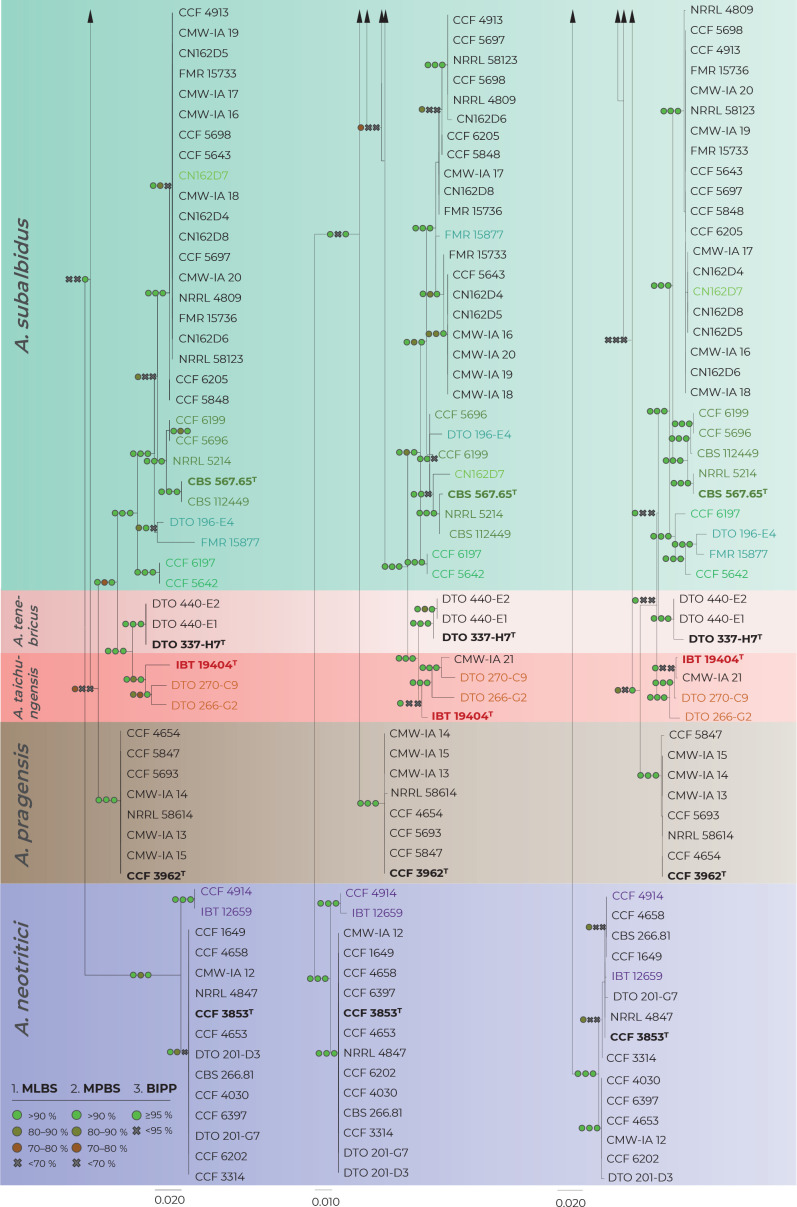
Fig. 2.
Comparison of single-gene genealogies based on the alignments of benA, CaM and RPB2 loci and created by three different phylogenetic methods. Single-locus maximum likelihood trees are shown; maximum likelihood bootstrap supports (MLBS), maximum parsimony bootstrap supports (MPBS) and Bayesian inference posterior probabilities (BIPP) are appended to nodes. Only MLBS and MPBS values ≥70 % and BIPP ≥0.95, respectively, are shown. A cross indicates lower statistical support for a specific node or the absence of a node in the MP and BI phylogenies. Selected strains or strain groups causing incongruences across single-gene phylogenies because of their unstable position are colour highlighted. The ex-type strains are designated with a superscripted T and bold print.


