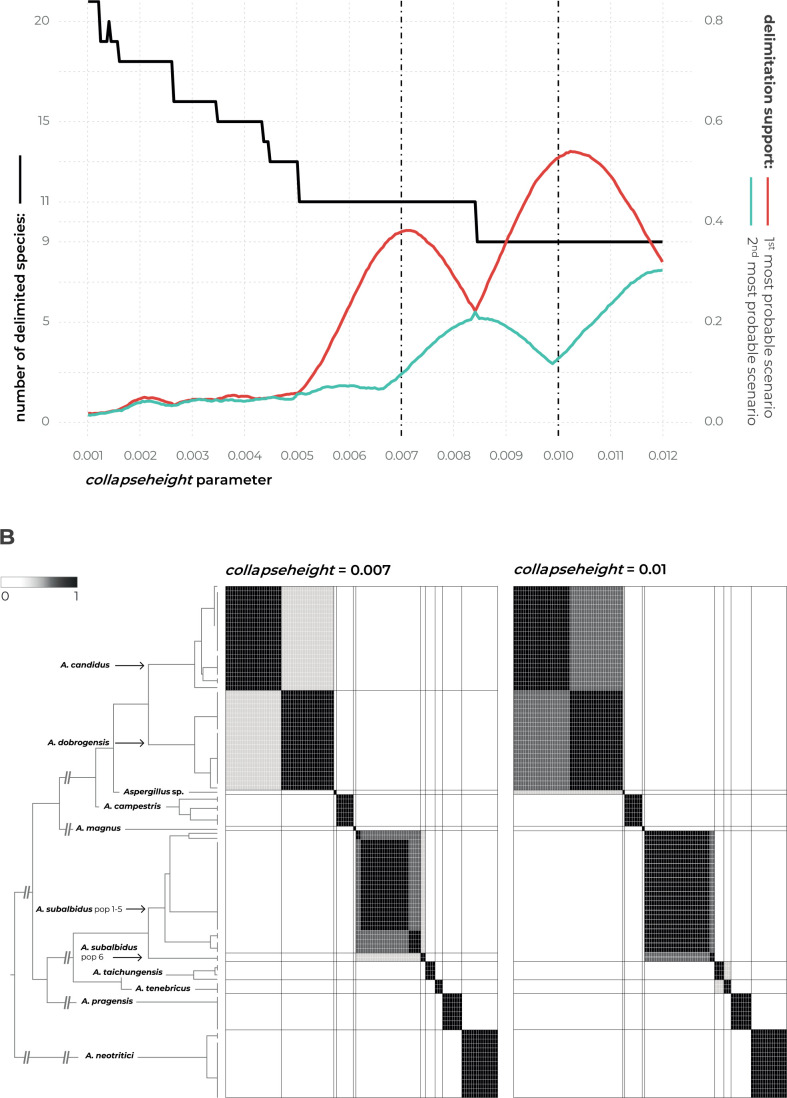
Fig. 4.
The results of species delimitation by using STACEY method. A. Dependence of delimitation results on collapseheight parameter. The black solid line represents the number of delimited species (left y-axis) depending on the changing value of collapseheight parameter (x-axis). The red line represents the probability (range from 0 to 1, right y-axis) of the most probable scenario at specific collapseheight value. The turquoise line represents the probability of the second most probable scenario at specific collapseheight value. Dashed vertical lines mark two values (0.007, 0.01) of collapseheight parameter whose results are shown in detail by similarity matrices (subfigure B). B. The similarity matrices give the posterior probability of every two isolates belonging to the same multispecies coalescent cluster (tentative species). The darkest black shade corresponds to a posterior probability of 1, while the white colour is equal to 0. Thicker horizontal and vertical lines in the similarity matrices delimit species or their populations that gained delimitation support in some scenarios.

