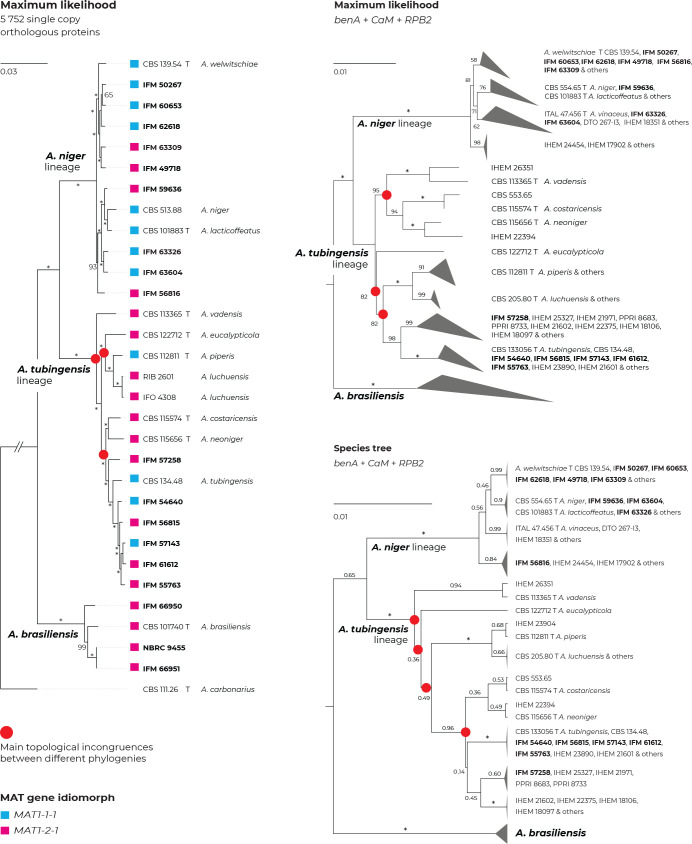
Fig. 4.
Comparison of topologies of phylogenetic trees constructed on the basis of different methods and data. Incongruences between phylogenies are designated with red circles. Maximum likelihood (ML) tree constructed based on the 5 752 orthologous proteins extracted from the 31 whole genome sequences (WGS; Supplementary Table S3) (left side); ML tree based on benA, CaM and RPB2 loci estimated in IQ-TREE (top right); species tree based on benA, CaM and RPB2 loci estimated in starBEAST (bottom right); the last two mentioned trees were constructed from combined three-gene alignments reduced to unique multilocus haplotypes (Table S5), and A. chiangmaiensis, A. pseudopiperis and A. pseudotubingensis were excluded. The most significant differences can be observed in the positions of A. neoniger, A. costaricensis and A. eucalypticola. Bootstrap support values or posterior probabilities are appended to the nodes, the support values equal to 100 % and 1.00, respectively, are designated with an asterisk; the ex-type strains are designated with the letter “T”. Isolates for which whole genomic sequences were generated in this study are designated with a bold print; mating-type gene idiomorphs are plotted on the tree based on the WGS data.

