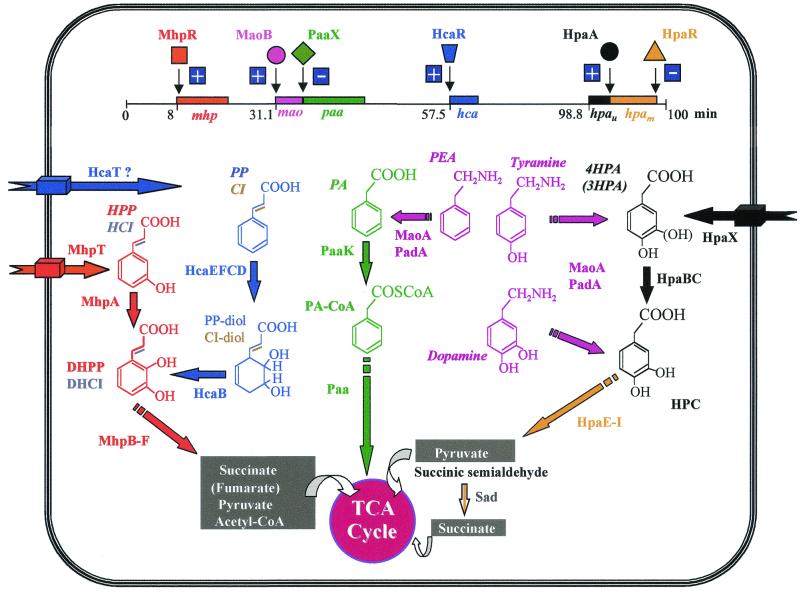
FIG. 13.
Schematic representation of the gene clusters and the encoded catabolic pathways for the aerobic degradation of aromatic compounds in E. coli. The gene clusters mhp, mao, paa, hca, hpau (upper route), and hpam (meta-cleavage route) are indicated by blocks and correspond to those described in Fig. 1 to 6. The locations of the clusters refer to the E. coli K-12 linkage map (the hpa cluster is absent in E. coli K-12). The regulatory proteins are indicated by different symbols that reflect the different regulatory protein families. + and − indicate transcriptional activation and repression, respectively. The transporters are represented by thick arrows spanning the cellular envelope. Abbreviations of the metabolites and enzymes are the same than those used in Fig. 1 to 6. The different colors correspond to the different catabolic pathways (or to different routes within the same pathway). A discontinuous arrow indicates more than one enzymatic step. TCA, tricarboxylic acids.

