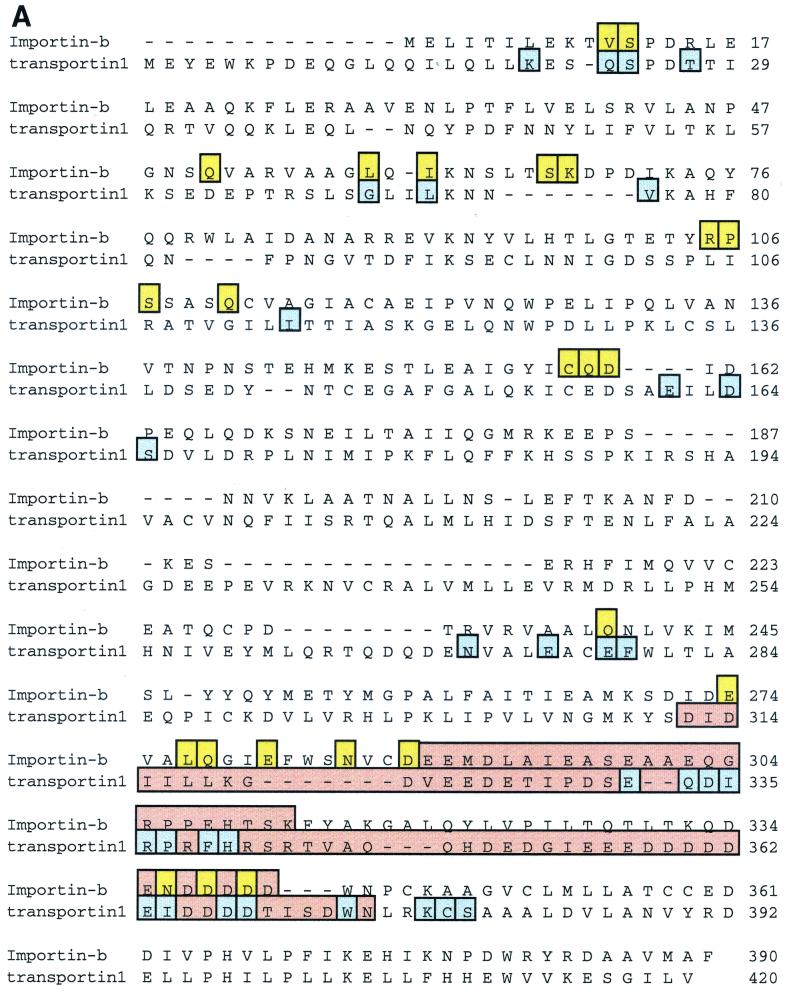
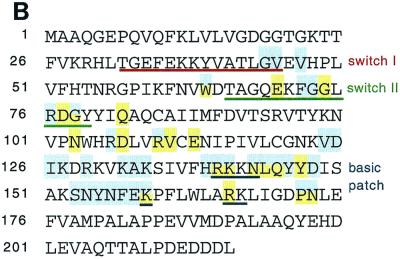
FIG. 4.
Comparison of the Ran-GTP interacting surfaces between importin-β and transportin1. (A) Alignment of the Ran binding domains of importinβ and transportin1. Residues in importinβ that bind Ran are shown in yellow. Residues in transportin1 that bind Ran are shown in blue. Loop7 is indicated in pink. (B) Amino acid sequence of Ran showing the Switch 1 and Switch 2 regions that undergo a conformational switch between the GTP and GDP binding states, and the basic patch. Residues that bind importinβ are shown in yellow; residues that bind transportin1 are shown in blue (39, 263).


