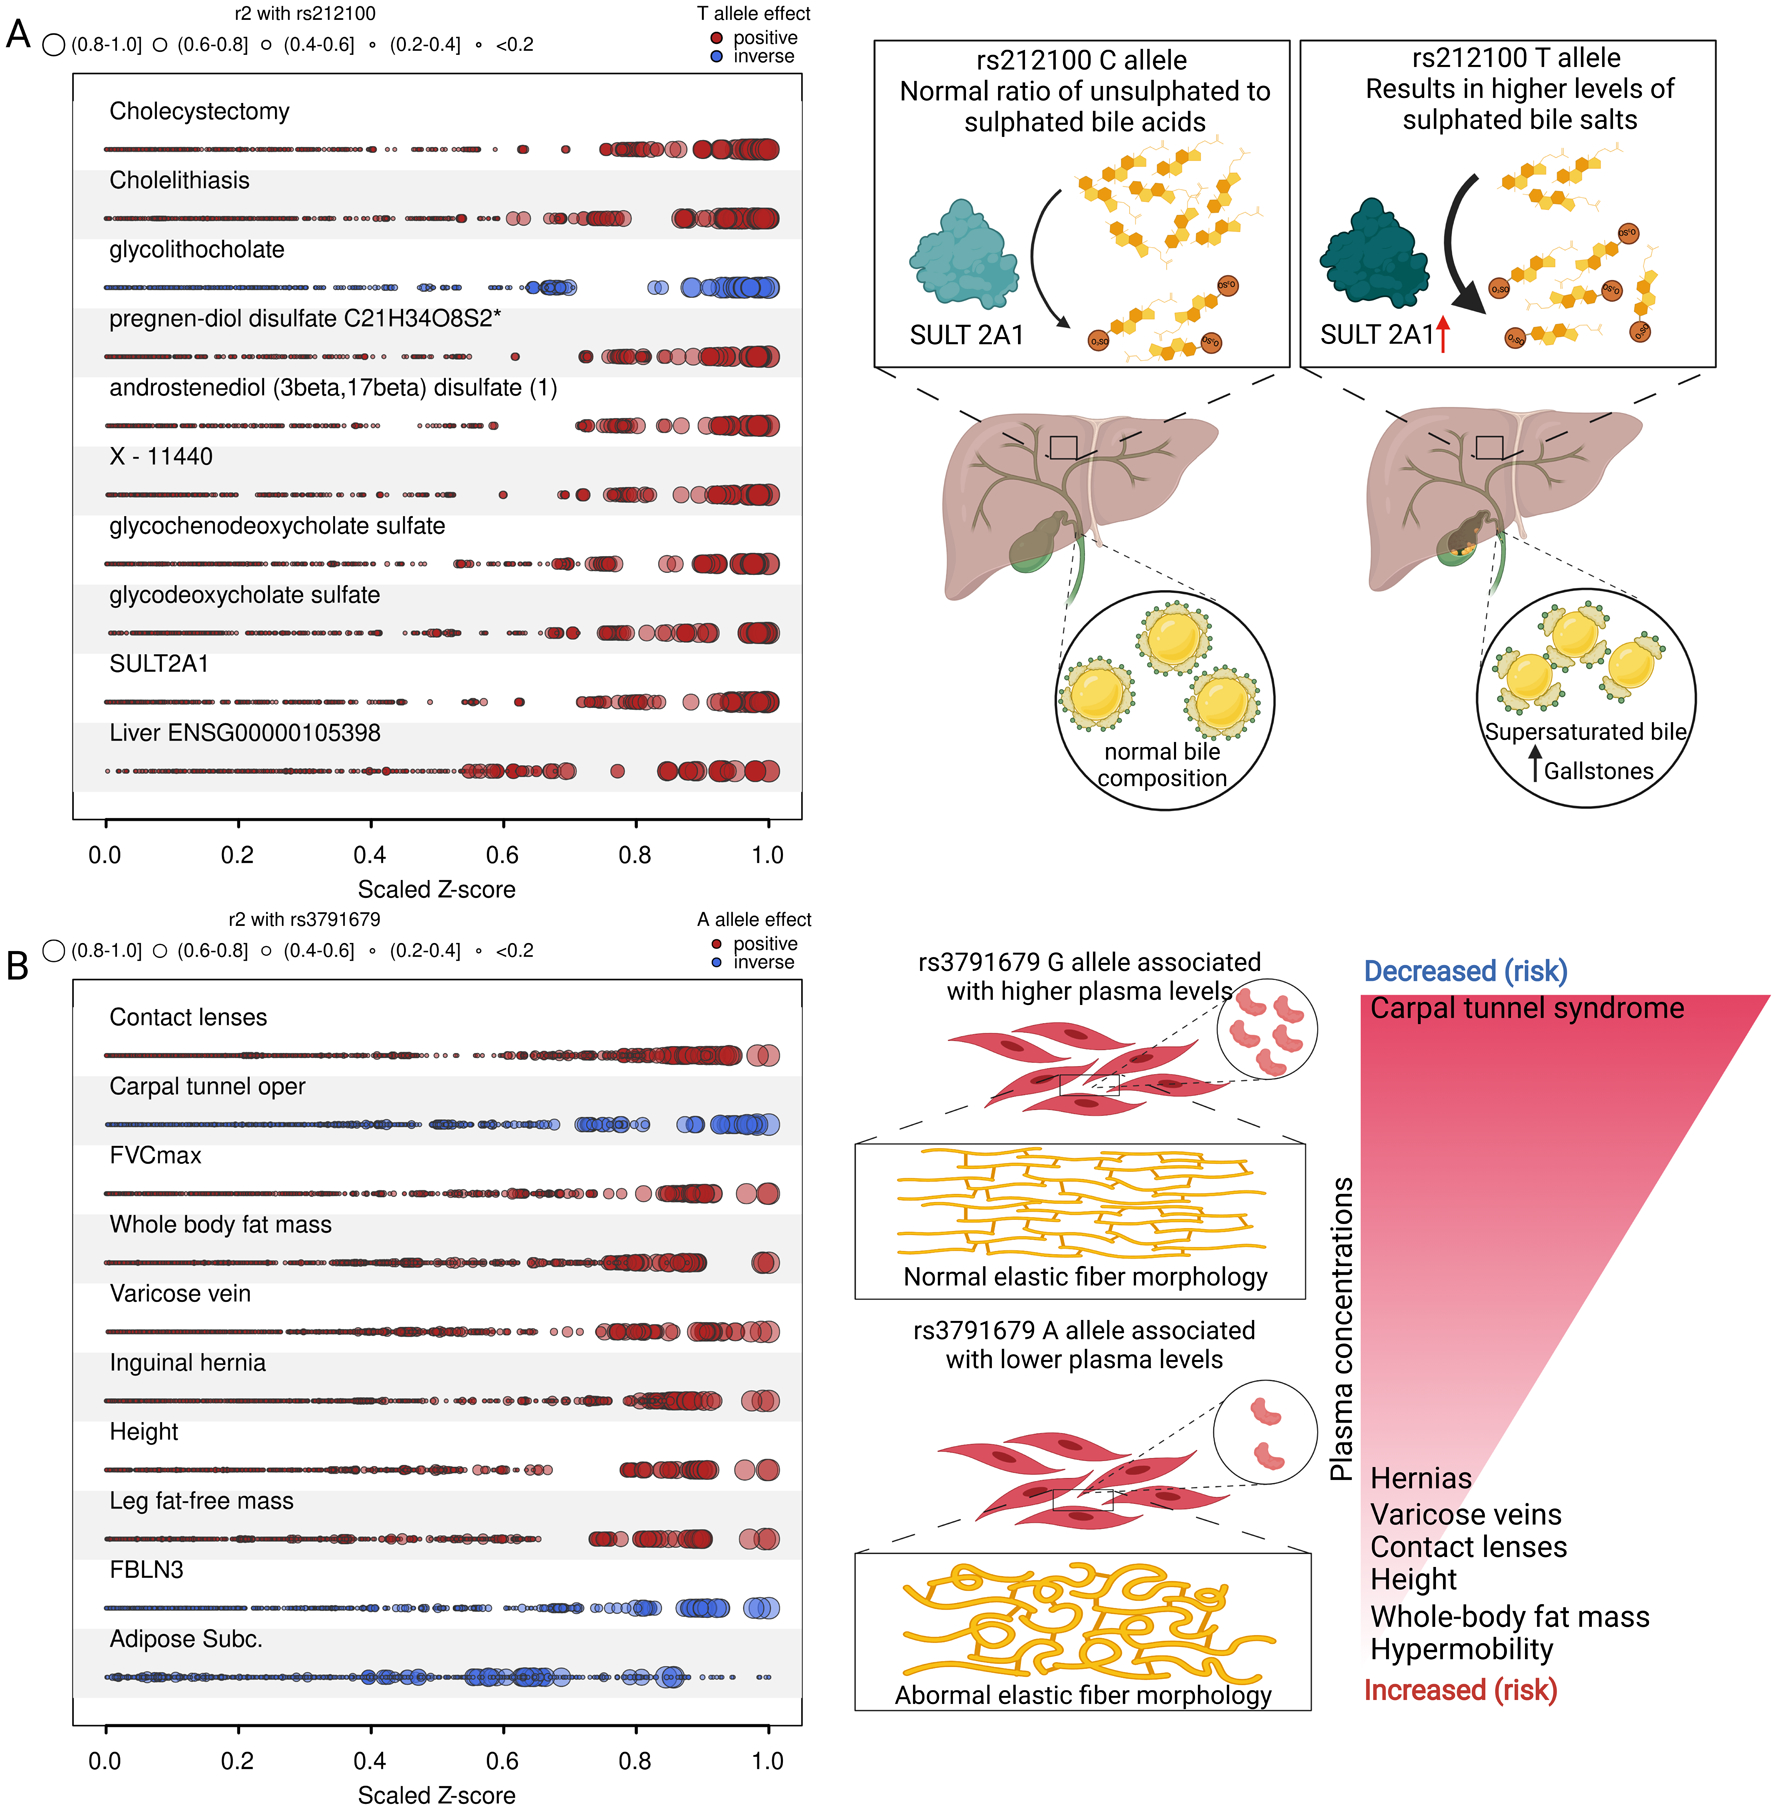
Fig. 6. Selected phenotypic examples from the proteogenomic map.

A) Plot visualizing convergence of genetic variants at the SULT2A1 locus in relation to the LD with the candidate gene variant identified by multi-trait colocalization. Z-scores from GWAS for each annotated trait have been scaled by the absolute maximum, and dot size is proportional to the LD (r2). Colors indicate the direction of effect aligned to the risk-increasing allele (red – positive, blue - inverse). The scheme on the right depicts the suggested mode of action by which higher SULT2A1 activity translates to higher risk of gallstones. B) Same as A, but for diseases and other phenotypes colocalizing at the EFEMP1 locus. The scheme on the right depicts a proposed mechanism by which altered secretion of FBLN3 leads to the observed phenotypes. Stacked regional association plots for A and B can be found in Figs. S9 and S10.
