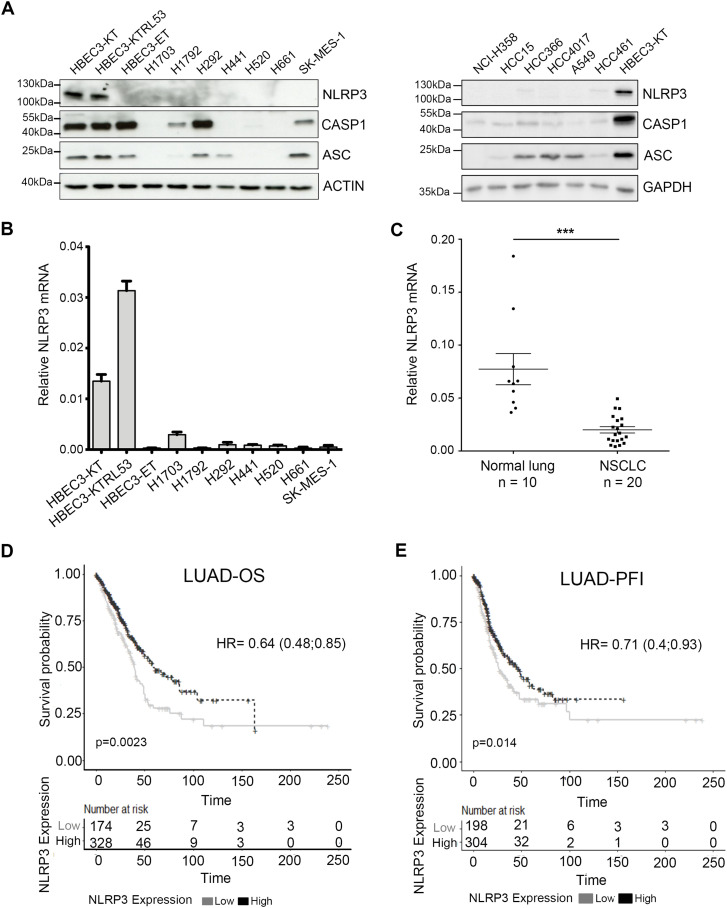
Figure 1. NLRP3 expression is reduced in human NSCLC compared with healthy tissue.
(A) Protein levels of NLRP3 and the inflammasome components, namely, caspase-1 (CASP1) and ASC, were assessed by immunoblotting in HBEC3 cells and a panel of NSCLC lines. Actin and GADPH served as loading controls. (B) Relative NLRP3 mRNA levels determined by Q-RT-PCR in HBEC3 cells and in a panel of NSCLC cell lines normalized against the ubiquitous esterase-D. Results are representative of more than three experiments. (C) Relative NLRP3 mRNA levels were determined by Q-RT-PCR in a cohort of non-treated primary tumors from NSCLC patients (n = 20) and the corresponding normal lung tissues (n = 10) normalized against esterase-D and HPRT1. Data represent mean ± SEM; ***P < 0.001 (t test). (D, E) Kaplan–Meier plots of patient overall survival (D) and progression free interval (E) in TCGA–LUAD dataset according to NLRP3 expression levels, time is shown in months; patients were stratified according to the cutoff obtained from maximally selected rank statistics.

