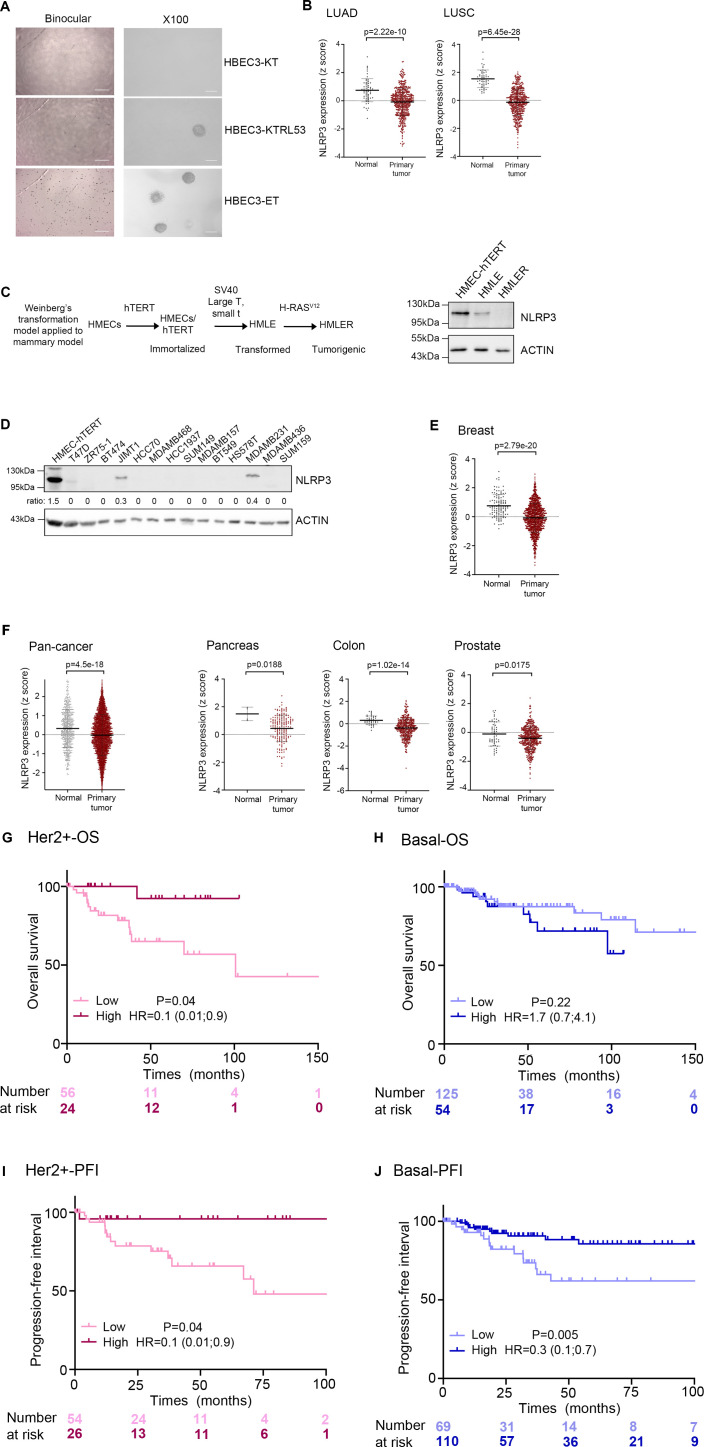
Figure S1. NLRP3 expression is reduced during malignant cell transformation and in cancer tissues.
(A) Anchorage-independent growth ability was assessed in HBEC3 cell lines (×4, ×100). (B) Expression of NLRP3 in 515 LUAD or 501 LUSC primary tumors compared with 59 and 51 lung normal tissues, respectively, from pan-cancer TCGA dataset. The differences between the median values of each two groups were compared using the Welch’s t test on the UCSC Zena browser. (C) Upper panel, diagram recapitulating the different stages of immortalization and transformation of HMECs (Elenbaas et al, 2001), lower panel, immunoblot showing the expression of NLRP3 in the different HMEC cell lines. (D) Immunoblot showing NLRP3 expression in breast cancer cell lines. Actin was used as a loading control. The ratio between NLRP3/actin is shown. (E) Expression of NLRP3 in 1,097 breast primary tumors compared with 132 breast normal tissues from TCGA. The differences between the median values of the two groups were compared using the Welch’s t test on the UCSC Zena browser. (F) Expression of NLRP3 in 9,701, 178, 449, and 178 primary tumors from pan-cancer, pancreatic, colon, and prostate, respectively, compared with normal tissues from TCGA. (G, H, I, J) Kaplan–Meier plots of patient overall survival for HER2+ (G) and basal (H) breast cancers, and progression-free interval for HER2+ (I) and basal (J) in TCGA breast cancers dataset according to NLRP3 expression levels, time is shown in months; patients were stratified according to the cutoff obtained from maximally selected rank statistics.

