Fig. 2.
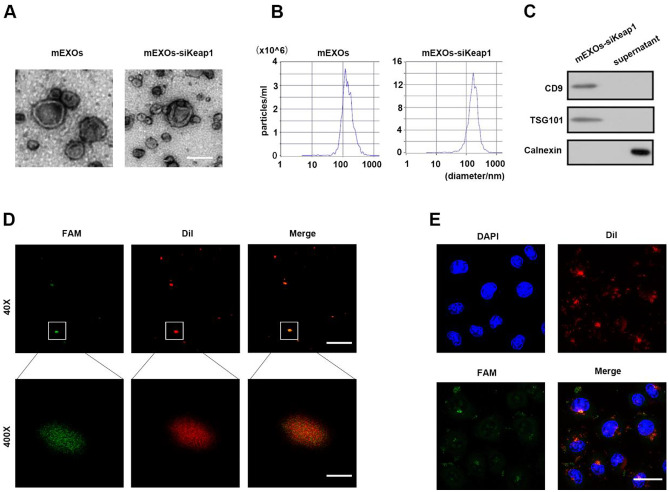
Characterization of mEXOs and mEXOs-siKeap1. A TEM images showing the morphology of mEXOs. Scale bar, 100 nm. B NTA results showing the size distribution of mEXOs. C Western blotting analysis of exosomal markers CD9 and TSG101. D Confocal microscopy analysis reveals that the mEXOs-siKeap1 were successfully synthetized. Red and green fluorescence represents mEXOs and siKeap1, respectively. Scale bar, 100 μm (40 ×) and 10 μm (400 ×). E The uptake of mEXOs-siKeap1 by HUVECs. Scale bar, 50 μm

