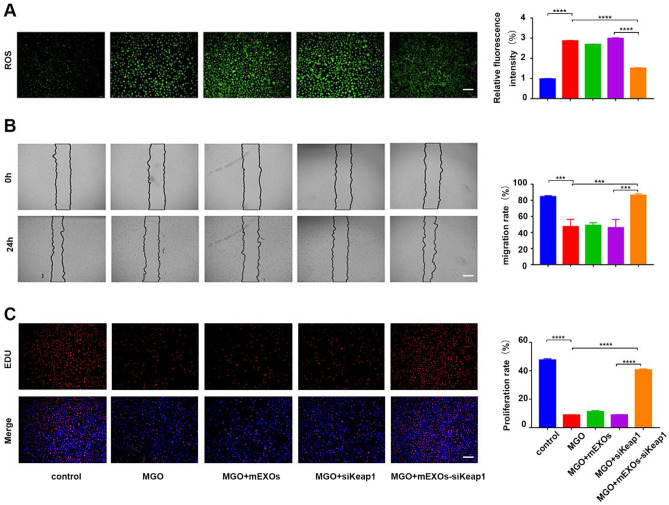
Fig. 3.
mEXOs-siKeap1 improve cell function in MGO-treated HUVECs. A The ROS levels of HUVECs in each group. n = 3, ****p < 0. 0001 vs. MGO. Scale bar, 50 μm. B Analysis of HUVEC migration by cell scratch test. n = 3, ****p < 0.0001 vs. MGO. Scale bar, 250 μm. C EdU assay analysis of the proliferation rate of HUVECs. The proliferating cells and cellular nuclei were stained with red and blue fluorescence, respectively. n = 3, ****p < 0.0001 vs. MGO by one-way ANOVA with Tukey’s post-hoc test. Scale bar, 100 μm. Data are presented as mean ± SD

