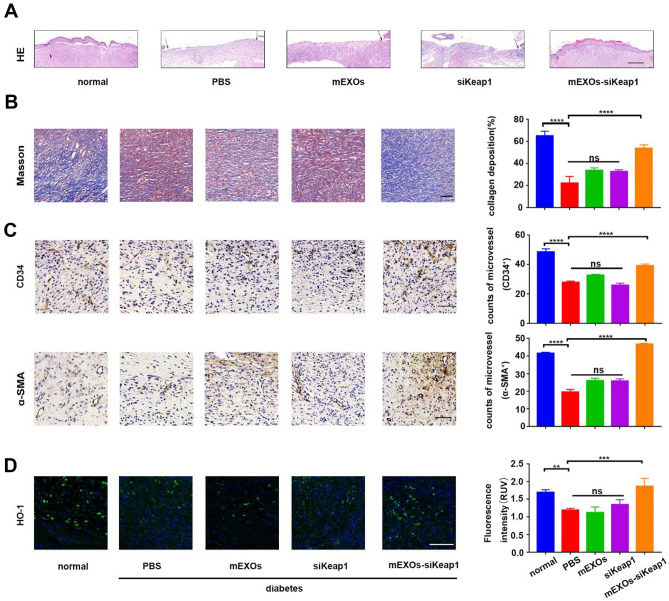
Fig. 5.
Histological, immunohistochemical, and immunofluorescent analysis of wound tissues. A H&E staining analysis of wound sections at day 19 post-wounding. The black single-headed arrows indicate the un-epithelialized areas. Scale bar, 500 μm. B Masson staining for the evaluation of collagen deposition at day 19 post-wounding. ****p < 0.0001 vs. PBS. Scale bar, 200 μm. C The expression of angiogenic markers in skin wound tissue, including CD34 and α-SMA, as assessed by immunohistochemical analysis. ****p < 0.0001 vs. PBS. Scale bar, 100 μm. D Immunofluorescence staining against the antioxidant protein HO-1 at day 19 post-wounding. ***p < 0.001 vs. PBS by one-way ANOVA with Tukey’s post-hoc test. Scale bar, 100 μm. Data are presented as means ± SD

