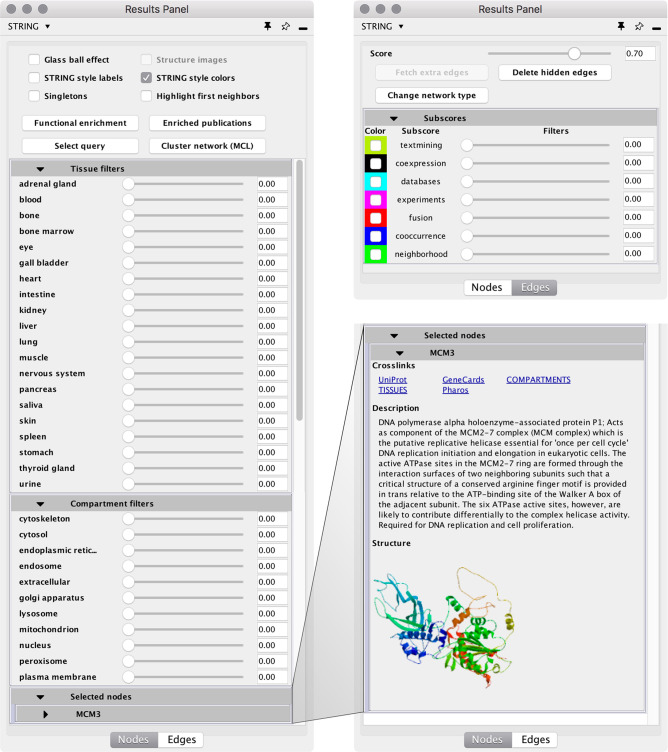
Figure 2.
stringApp Results panel in Cytoscape. The Nodes tab (left) provides quick access to changing different visual properties, running network analysis tasks, and filtering based on tissue and subcellular localization. It also contains a panel with information for each currently selected node, as shown for MCM3 (bottom right). The Edges tab allows users to change the network type and confidence as well as to filter and color the edges based on evidence.

