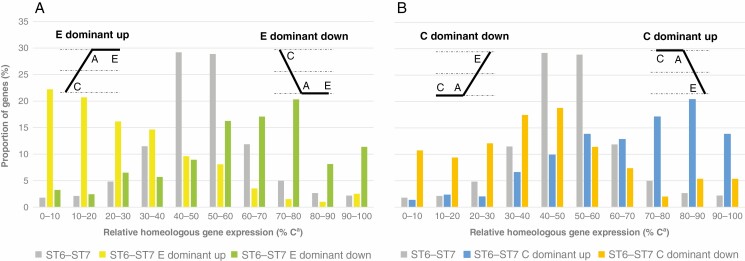
Fig. 4.
Comparison of homeologous gene expression distributions of C. arabica genes classified in C and E dominant up and down categories at ST6–ST7 with homeologous gene expression distribution of 8180 genes expressed at this seed maturation stage (χ 2 test = 741.72, d.f. = 9, P-value < 2.2 × 10⁻¹⁶ for E dominant up category, χ 2 test = 144.35, d.f. = 9, P-value < 2.2 × 10⁻¹⁶ for E dominant down category, χ 2 test = 584.49, d.f. = 9, P-value < 2.2 × 10⁻¹⁶ for C dominant up category and χ 2 test = 151.61, d.f. = 9, P-value < 2.2 × 10⁻¹⁶ for C dominant down category). The patterns of gene expression for the four categories considered are shown above the corresponding distribution.

