Table 1.
Gene expression levels in C. arabica compared with its parental species during seed maturation for 22 165 genes
| Expression pattern | ST3–ST4 | ST5 | ST6–ST7 | P-value | |
|---|---|---|---|---|---|
| No difference | 15 632 (70.5 %) | 15 067 (68.0 %) | 14 792 (66.7 %) | <2.2 × 10⁻¹⁶ | |
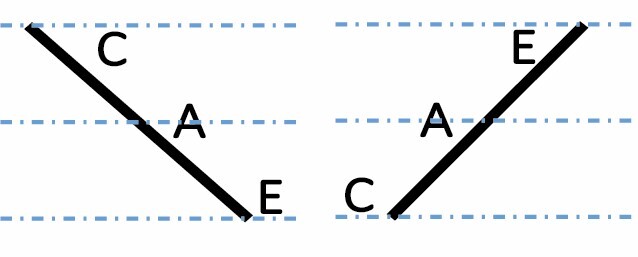
| Additive |
|
402 (1.8 %) | 441 (2.0 %) | 443 (2.1 %) | 0.2805 |
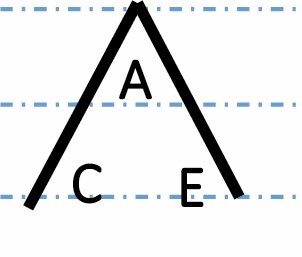
| Transgressive up |
|
939 (4.2 %) | 854 (3.9 %) | 900 (4.1 %) | 0.1222 |
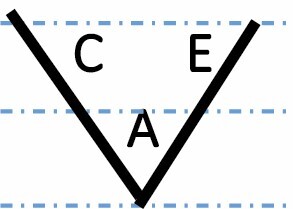
| Transgressive down |
|
563 (2.6 %) | 635 (2.8 %) | 546 (2.5 %) | 0.0198 |
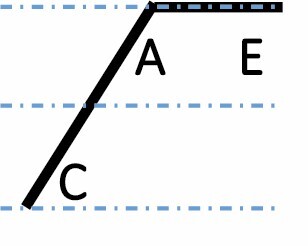
| E dominant up |
|
1048 (4.7 %) | 905 (4.1 %) | 921 (4.2 %) | 0.0012 |
| E dominant down |
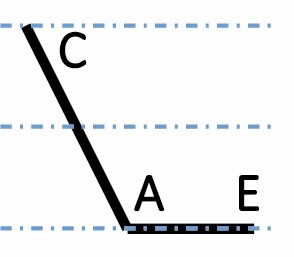
|
1234 (5.6 %) | 1480 (6.7 %) | 1679 (7.5 %) | <2.2 × 10⁻¹⁶ |
| C dominant up |
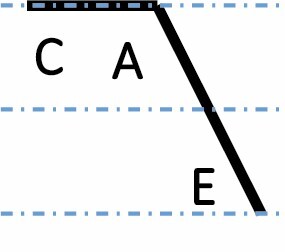
|
1308 (5.9 %) | 1110 (5.0 %) | 1540 (6.9 %) | <2.2 × 10⁻¹⁶ |
| C dominant down |
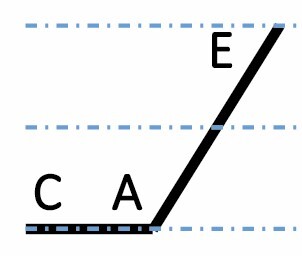
|
1039 (4.7 %) | 1673 (7.5 %) | 1344 (6.1 %) | <2.2 × 10⁻¹⁶ |
A, C and E correspond to C. arabica, C. canephora and C. eugenioides, respectively. Differential gene expression between the three species is indicated by the dashed-dotted lines for each gene expression category (gene expression in C. arabica deviated >1.25-fold from that of either parental species). The proportions of each category were compared between maturation stages (prop.test, 0.01 as the significance threshold P-value).
