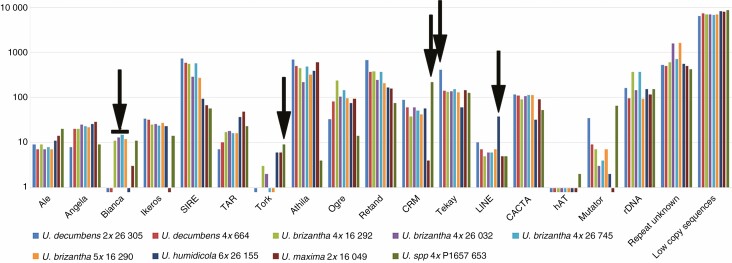
Fig. 3.
Relative abundance (log) of DNA sequence classes in Urochloa species and hybrids from whole-genome sequence reads. Automated repeat identification of graph-based clustering (RepeatExplorer, TAREAN) and abundant k-mer motifs were classified by nucleotide domain hits and database BLASTN searches (Supplementary Data Tables S7 and S9). Arrows indicate some motifs with differential abundance between accessions. Bars below 1 (y-axis) indicate abundance <0.01 % of genome.

